Housing Market Index

Are you a builder interested in being part of the HMI panel of respondents?
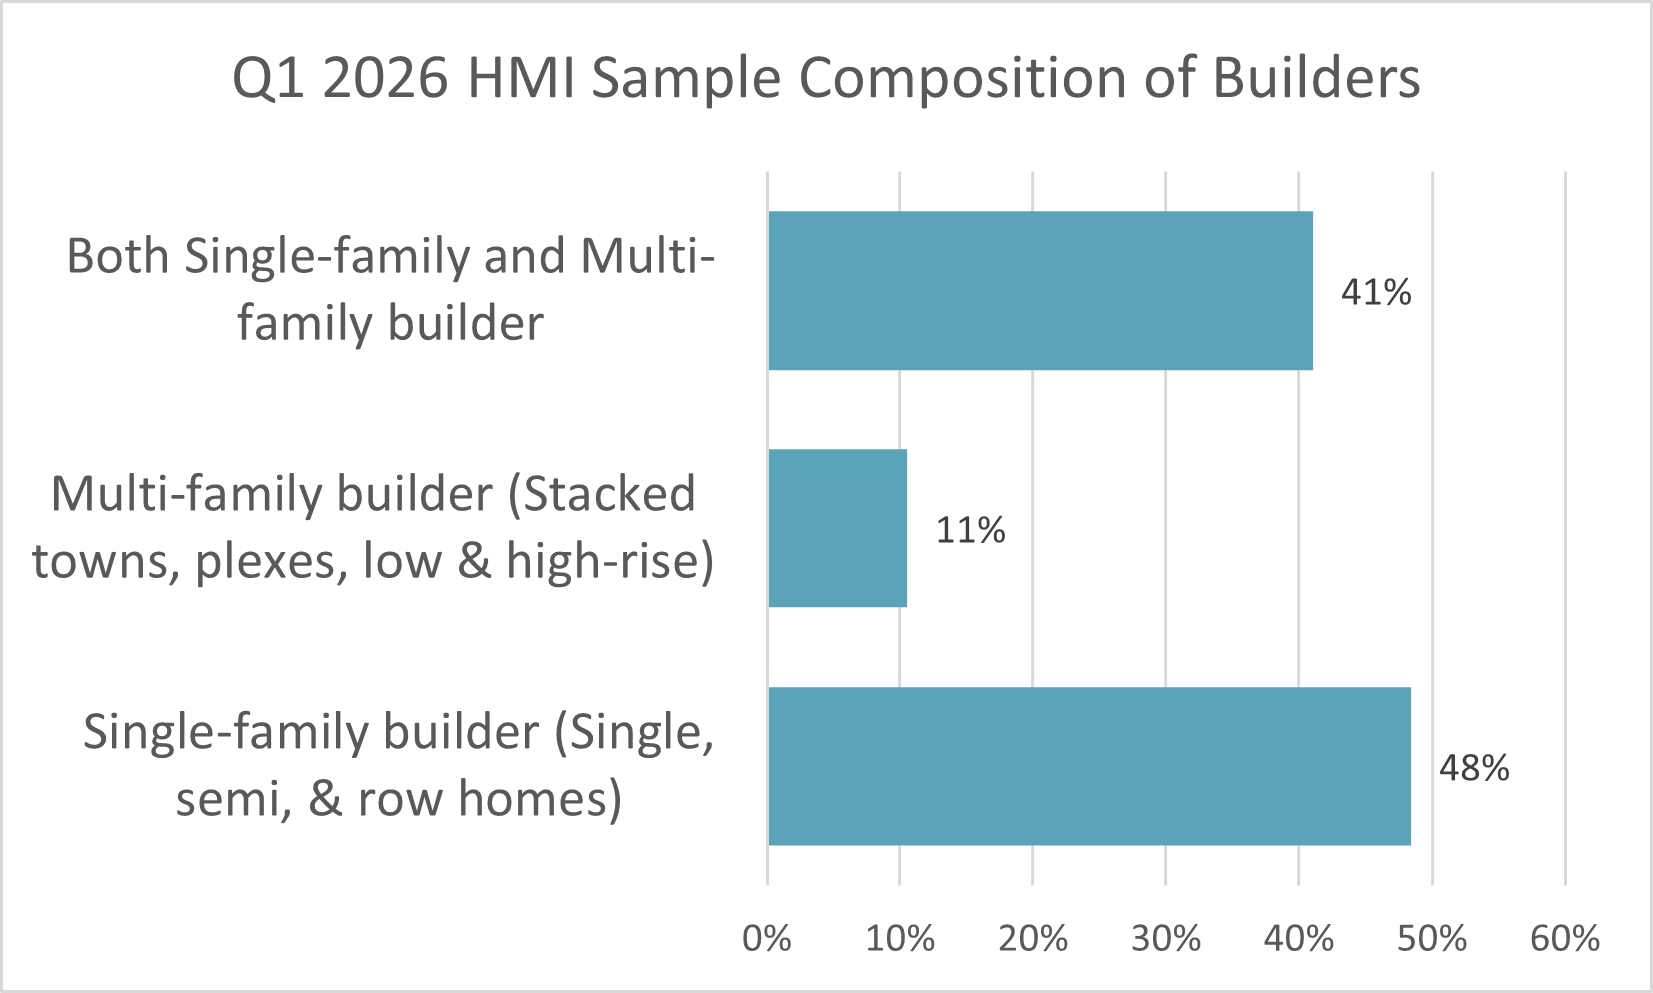
Single-Family
(includes single detached homes, semi-detached homes and row (townhouse) homes)

Multi-Family
(includes stacked townhouses, duplexes, triplexes, double duplexes and row duplexes, and low and high-rise apartment buildings)

Properties of the HMI
(i.e. how to read the number)
- The HMI is on a scale of 0 to 100
- It's 0 only when everyone says conditions are "poor"
- It's 100 only when everyone says conditions are "good"
- It's 50 when the % saying "good" = the % saying "poor"
Q1 2026 HMI
This page outlines the Q1 2026 results of CHBA’s Housing Market Index (HMI). This informative research and economics product provides a much-needed leading indicator about the current and future health of the residential construction industry in Canada with respect to housing units for ownership (freehold or condominium). The HMI is a sentiment indicator, assessing current selling conditions, expectations for selling conditions over the next six months, and the level of sales office traffic (or other measures of prospective buyer interest). It is a proven indicator of housing starts that can be expected in six months and beyond. CHBA has now also started a similar indicator for the renovation market, the CHBA Renovation Market Index (RMI).
The data for the CHBA HMI comes from a panel of CHBA homebuilders and developers from local and provincial home builders’ associations across Canada that respond to a series of questions about market conditions. CHBA then uses proprietary statistical analysis to prepare the quarterly HMI. In addition to the standard HMI questions, each quarter CHBA asks “special questions” that allow the Association to gather data and insights into current issues affecting the industry across the country.
CHBA’s HMI was modelled on the National Association of Home Builders’ (NAHB) very successful and influential US version. The NAHB version is used regularly by financial analysts, the Federal Reserve, policymakers, economic analysts, and the news media, given the importance of the health of the residential construction industry to the overall economy. Through the CHBA HMI, CHBA has done the same for Canada, where it is being used and followed by similar Canadian agencies (e.g. Bank of Canada, Statistics Canada), government policymakers, economists/analysts and media.
If you have any questions or feedback about the CHBA HMI, please contact hmi@chba.ca.
Summary for Q1 2026 HMI
Policy action is key to generating a turnaround in builder confidence
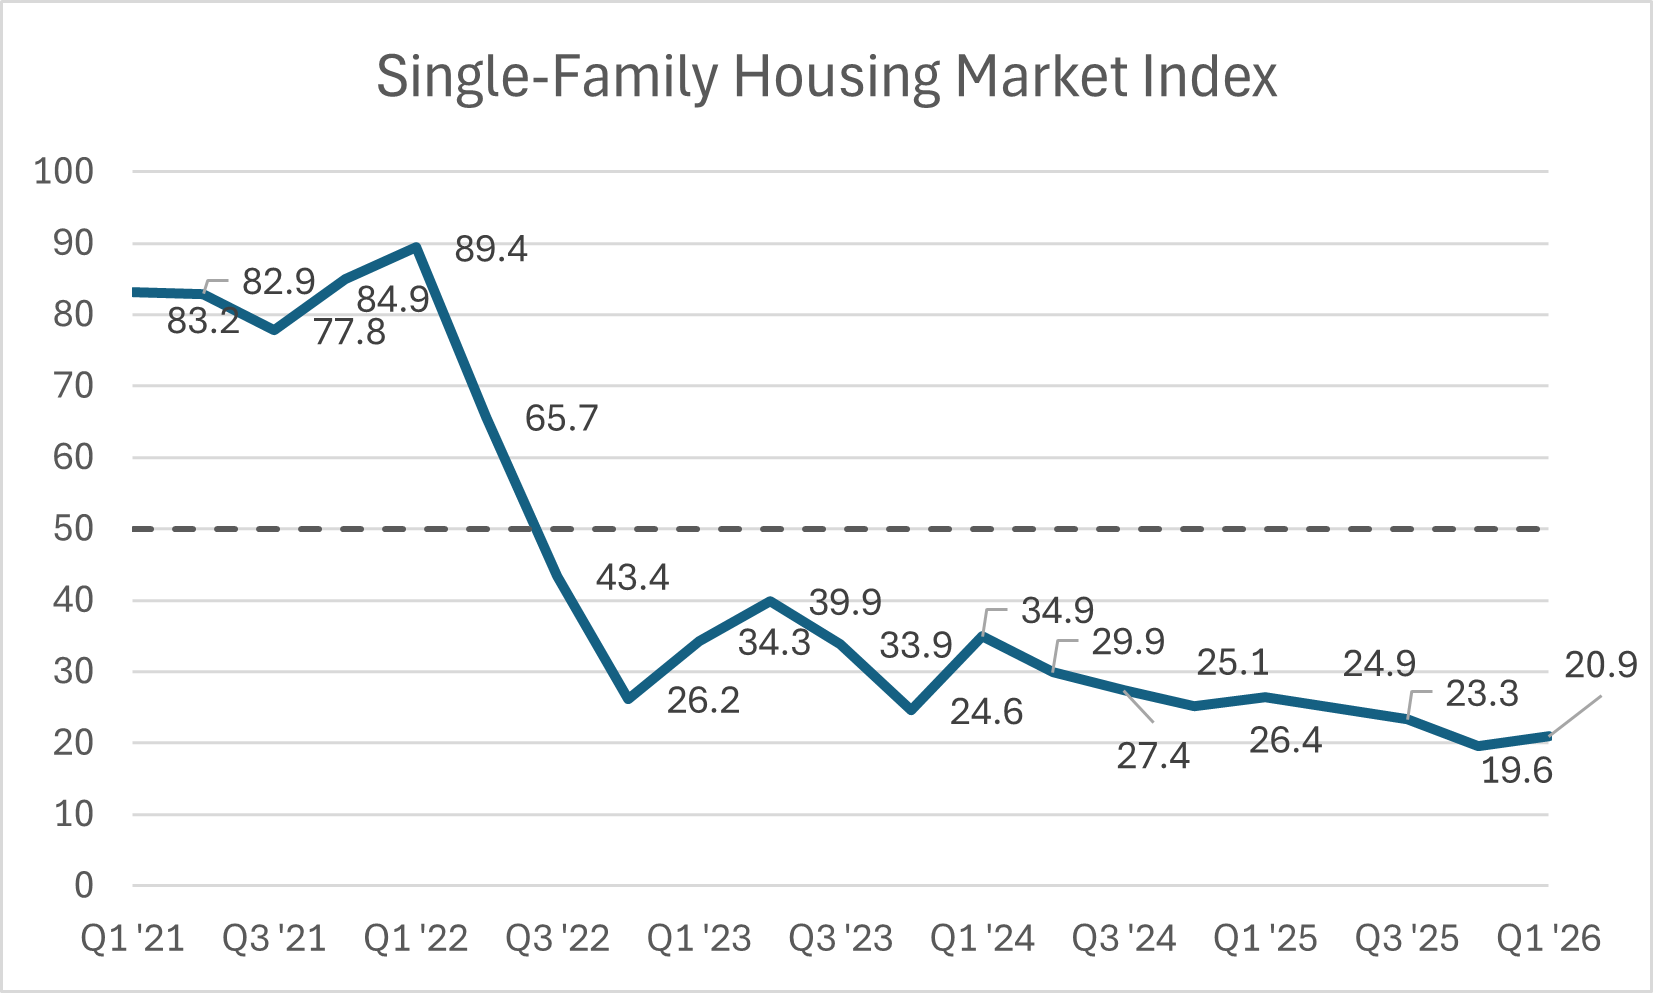
Builder confidence reflected bleak conditions to begin 2026. The single-family index fell 5.5 points from last year to 20.9 in the first quarter of this year. The multi-family index was 13.4 in Q1 2026, down 8.9 points from a year ago, and is the third consecutive new record low. These results continue to indicate the differences in health between units built for home ownership versus purpose-built rental housing development, which is masked in the report of monthly housing starts. The surge in purpose-built rentals has hidden in overall starts numbers the plummet of starts for homeownership. Furthermore, employment data generally does not capture residential construction well, given all the sub-contracting, masking the job losses and permanent loss of capacity for new home construction. Based on an extrapolation of monthly payroll employment data for residential construction, CHBA estimates that over 18,000 jobs were lost in Ontario alone in 2025.
Given these conditions, CHBA has been calling for more policy action on an urgent basis and applauds the federal government’s $1.7 billion one-time cash injection to provincial governments to reduce housing costs and support more housing supply. This includes the funding announced to go to Ontario, to be used to cover the federal portion of HST on all homes under $1 million and partially up to $1.85 million. The Ontario government will do the same for the provincial portion.
This is very positive for Ontario, so CHBA calls on other provincial governments to use the federal funding in similar fashion to directly lower the tax burden on buyers of new homes. Governments at all levels have begun to understand that government-imposed fees and processes have significantly contributed to the erosion of affordability of market-rate housing and the resultant lack of housing supply and they must take action accordingly.
It is also essential that once announced, such measures should be effective in short order, and should not be delayed by political processes for homeowners to access, which in turn can slow the market rather than help it get going. The federal GST rebate for first-time home buyers was delayed for almost a year in political process, so rather than helping the market, it kept buyers on the sidelines, hurting supply and contributing to more labour loss. It will be critical that the new HST/GST measures be accessible quickly to avoid similar problems.
This first quarter HMI survey was put into field a day before the Ontario government announced this measure. While this remains one of the most important policy announcements for new home prices to date, the delayed rollout of official rules and forms left buyers still unable to officially claim the rebate. As such, the HMI data did not capture a material increase in Ontario builder sentiment as of yet. Both builders and homebuyers need certainty before making a commitment. This requires all political process to be finished rapidly and the forms be available for submission to the CRA. CHBA expects that if implemented quickly, this should lead to improvement in builder sentiment in Ontario in the second quarter, during the spring selling season, which would be reflected in the next HMI survey.
Given the above, regionally there continued to be little change in the extremely negative sentiment in Ontario and British Columbia for the Q1 HMI. Early indications are that Ontario will see a boost to its HMI thanks to the above. BC, on the other hand, has yet to sign its deal with the federal government, and will also have to use the funds wisely—if they are not directed towards reducing taxes but instead towards more nebulous “housing programs,” the BC negative HMI trend will continue.
Looking to other regions, very notable was the continued decline in the multi-family HMI for the Prairie provinces, where a score of 37.6 represented not only its first recent pessimistic reading, but also a year over year index decline of over 35 points. Also notable is the first pessimistic reading on record for the single-family HMI for Atlantic Provinces. The Prairies and Atlantic Canada had been weathering the trade war storm driving eroded consumer confidence, but these HMI results show that they, too, are now seeing those effects, indicating fewer housing starts ahead in what had been resilient markets.
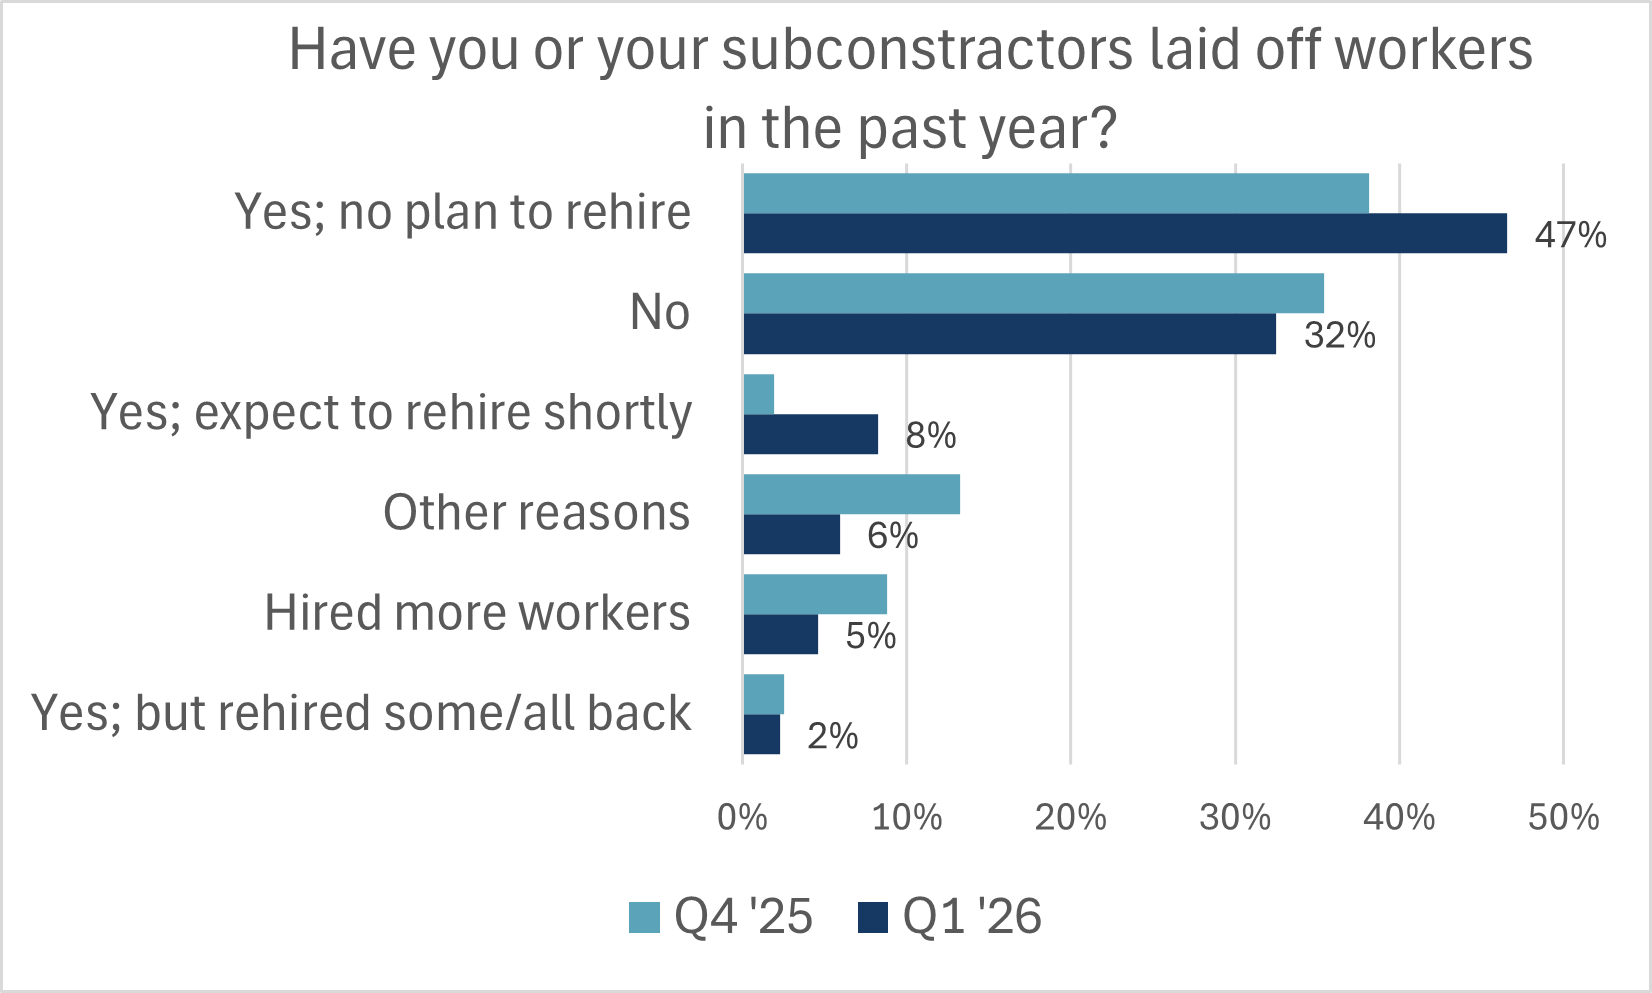
The HMI special questions also show that labour market conditions continued to get even worse, driven by further losses in Ontario. Nationally, 47% of builders said that they or their subcontractors have needed to lay off workers due to market conditions. In Ontario this proportion rose to 65%, climbing even higher than in recent quarters. Official payroll data shows that Ontario residential construction employment lost six to seven percent of its direct workforce in 2025. This is a magnitude of Ontario housing industry employment contraction not seen since the global financial crisis in 2009.
CMHC’s latest housing starts (for March 2026) point to a continued loss of momentum in housing construction. National numbers also mask the severe regional slides and multi-year stagnation in starts for ground-oriented units for ownership, after declining sharply between 2022 and 2023. As starts for ownership continue their low performance, the 27,437 units slated for rental markets represented 56% of all urban starts and increased development by 4,878 units over Q1 2025. The Prairie provinces saw the largest annual decline in Q1 2026 single- and multi-family starts relative to in line with weakening HMI scores over the past year and after recent record setting years for starts in Alberta, showing even Alberta cannot stay immune to the impacts of the trade war indefinitely. The tradeoff from ownership to rental starts is accelerating, and the HMI indicates that this will continue.
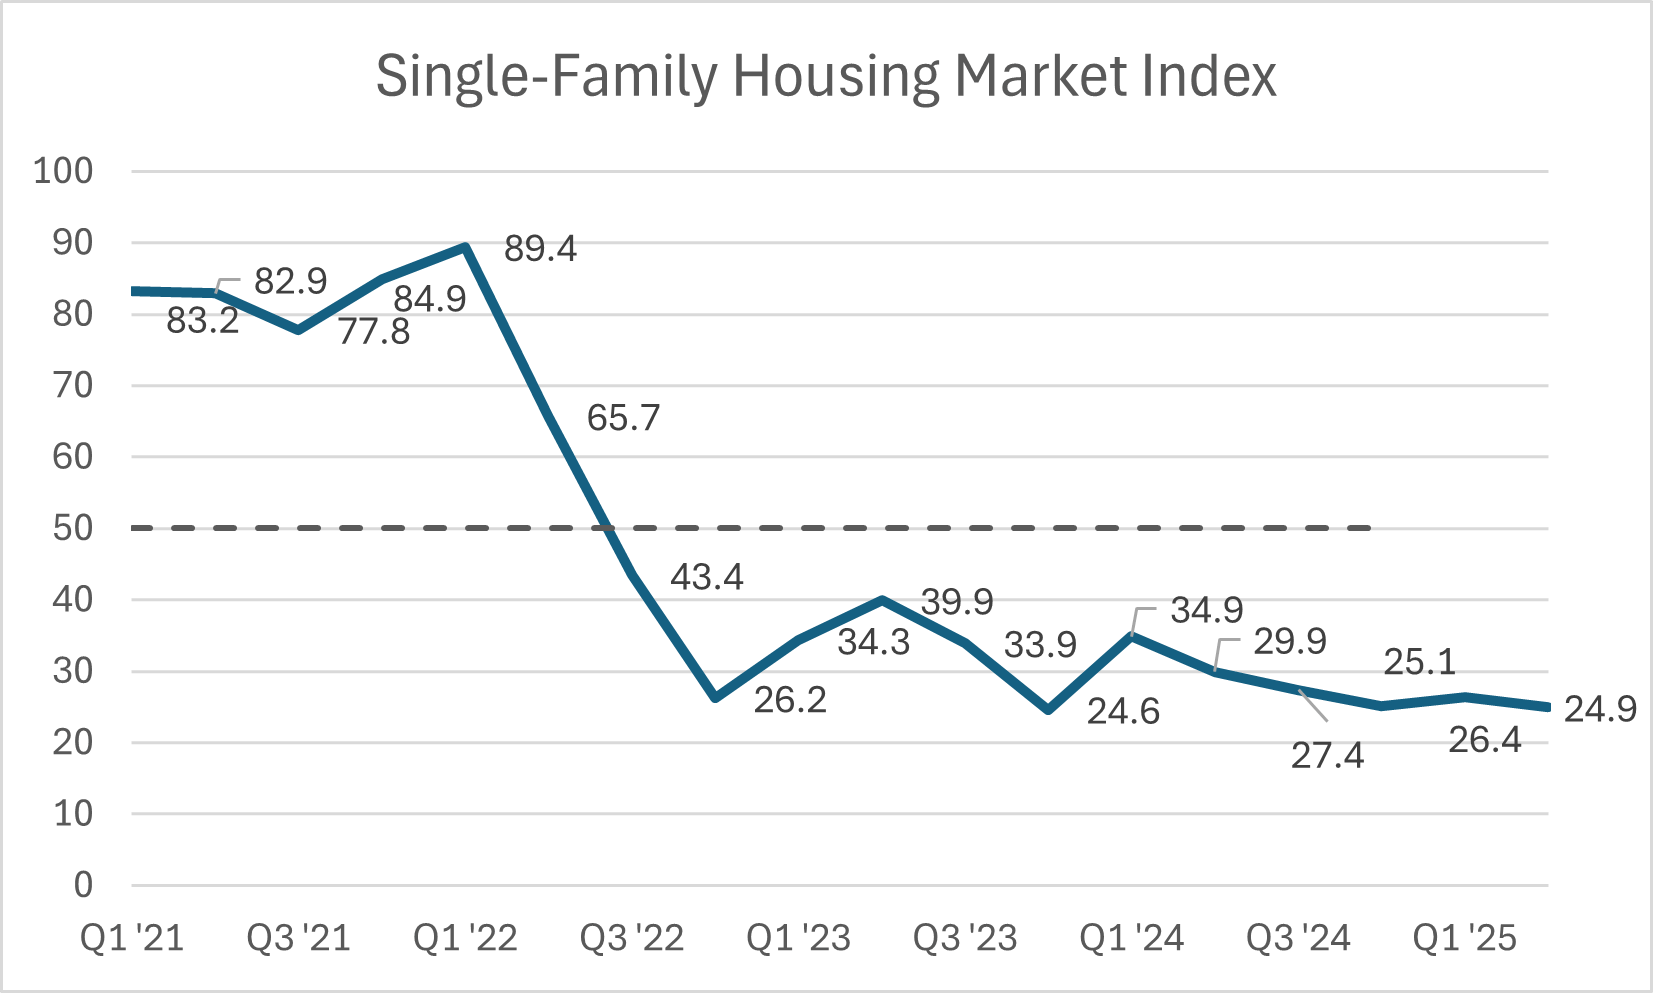
- The single-family index is 20.9 out of 100. This is only 1.3 points above the all-time record low for builder confidence set last quarter.
- For comparison, the single-family HMI produced by the NAHB, CHBA’s US counterparts, in the first quarter was 37.2. The US single-family HMI has consistently registered 10 to 20 points higher than the Canadian index since the second quarter of 2023.
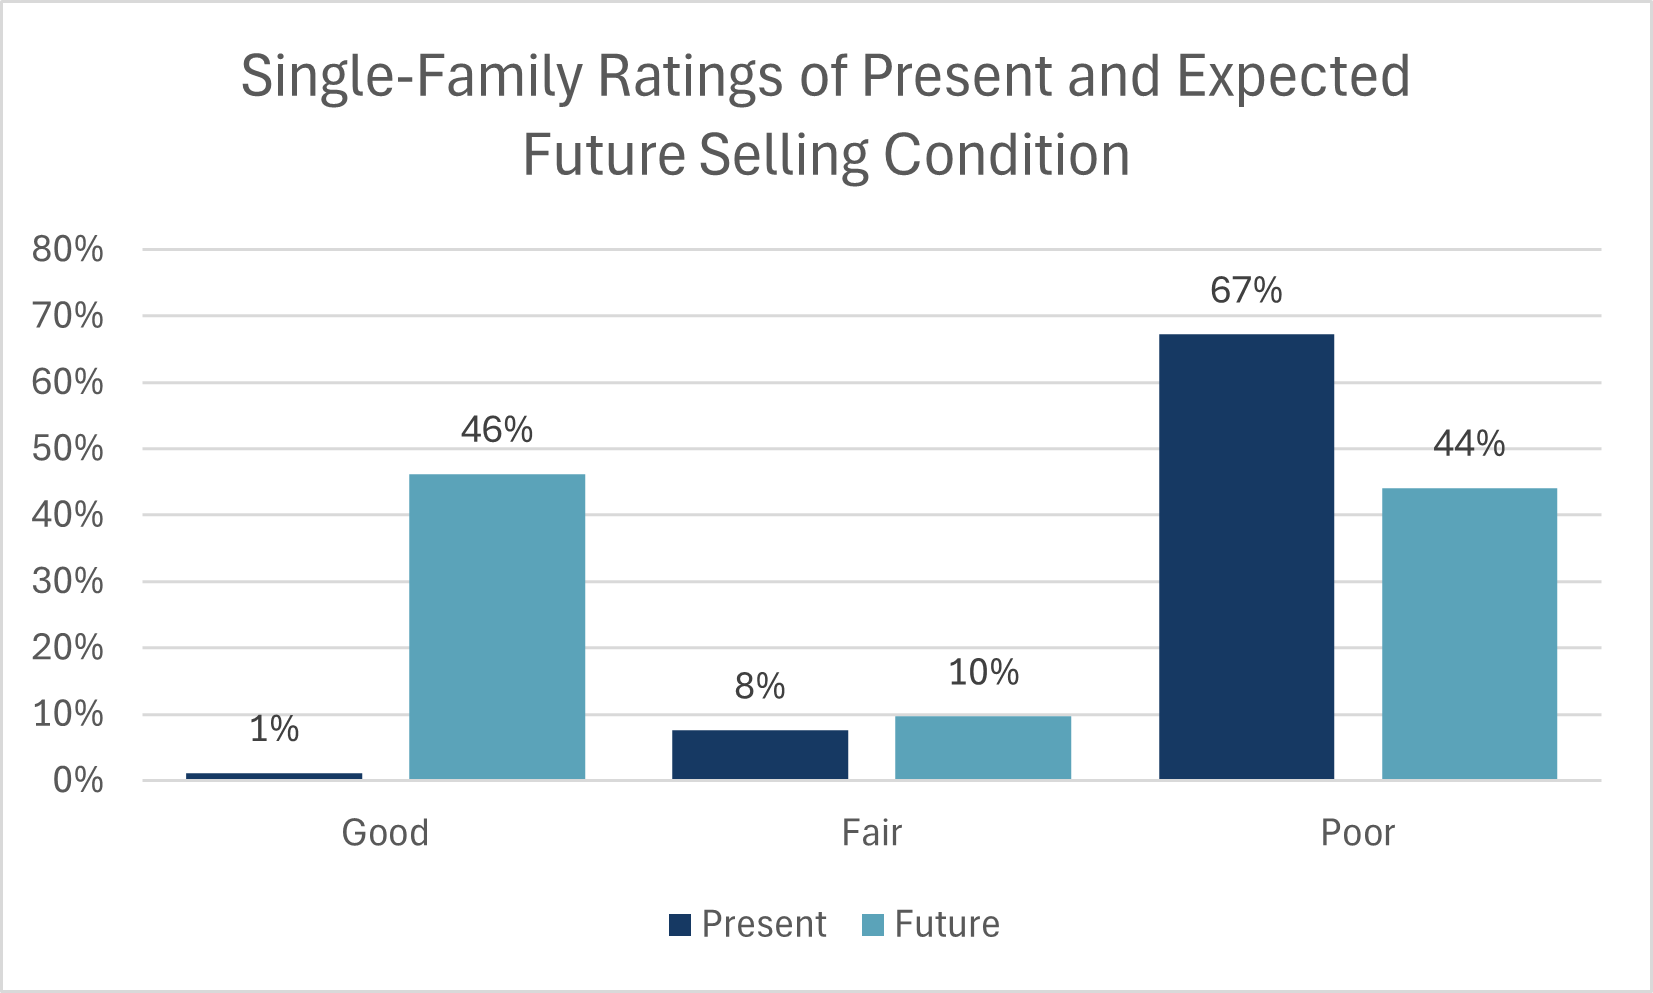
- Very similar to last quarter, two thirds of builders rated the current selling conditions as Poor. The present conditions subindex for Q1 is 9.2 points below the score from a year ago.
- 46% of builders believed that selling conditions of the next six months would be average for them, while 44% said they expect it to be Poor.
- Regionally, Ontario’s and British Columbia’s builder confidence remained in the doldrums. Ontario’s score of 10.2 and has remained within a narrow range between scores of 14.3 to 7.1 since the second quarter of 2024. British Columbia’s single-family down trend continued and its score of 5.8 is 11.4 points below Q1 2024 and the lowest score of the regions.
- Prairie provinces single-family index score of 38.6 follows a score of 32.8 to end 2025. These scores come after two years of neutral sentiment readings. Atlantic Canada score of 43.5 is considered neutral but this is its lowest score on record.

- The multi-family index is 13.4 out of 100. This is unfortunately another record low and 8.9 points below the score from Q1 2025.
- 80% of multi-family builders nationally said that the current selling conditions are Poor. The present conditions subindex has set a new record low in each of the last six quarters, mainly due to deteriorating present multi-family conditions in the Prairie provinces.
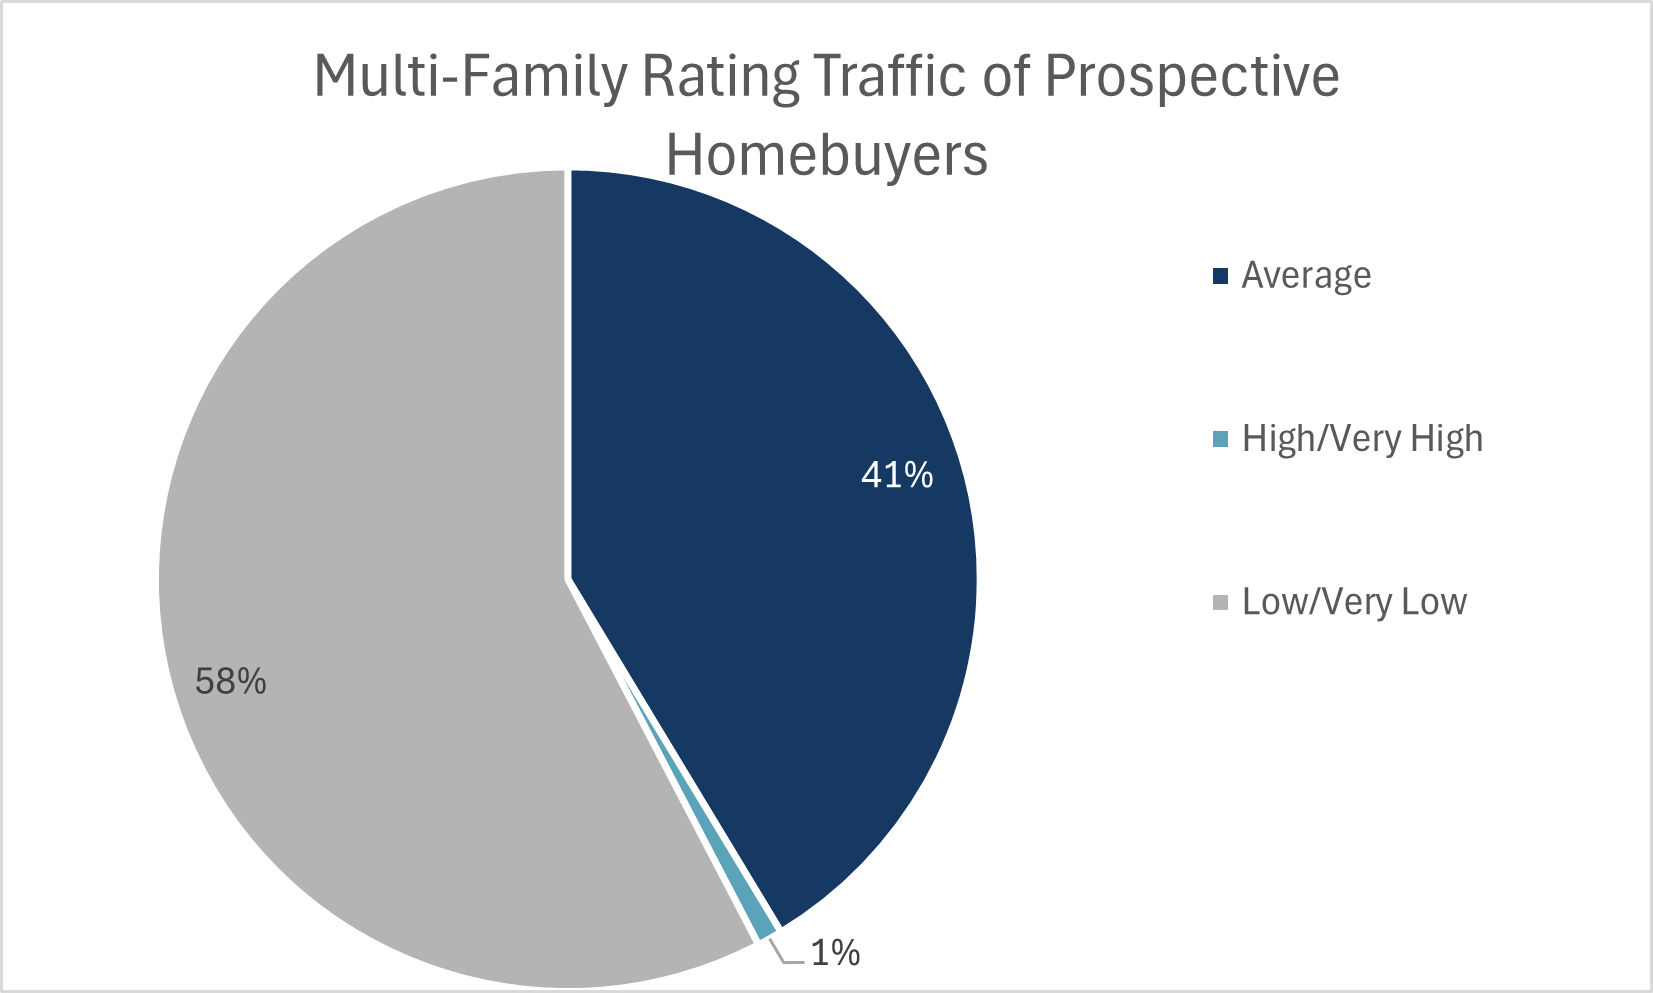
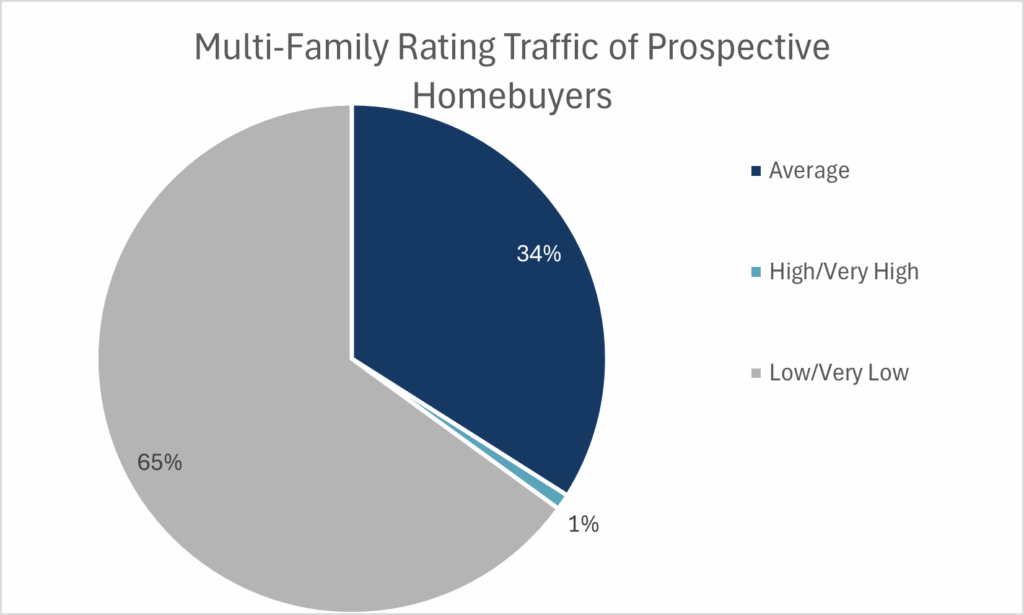
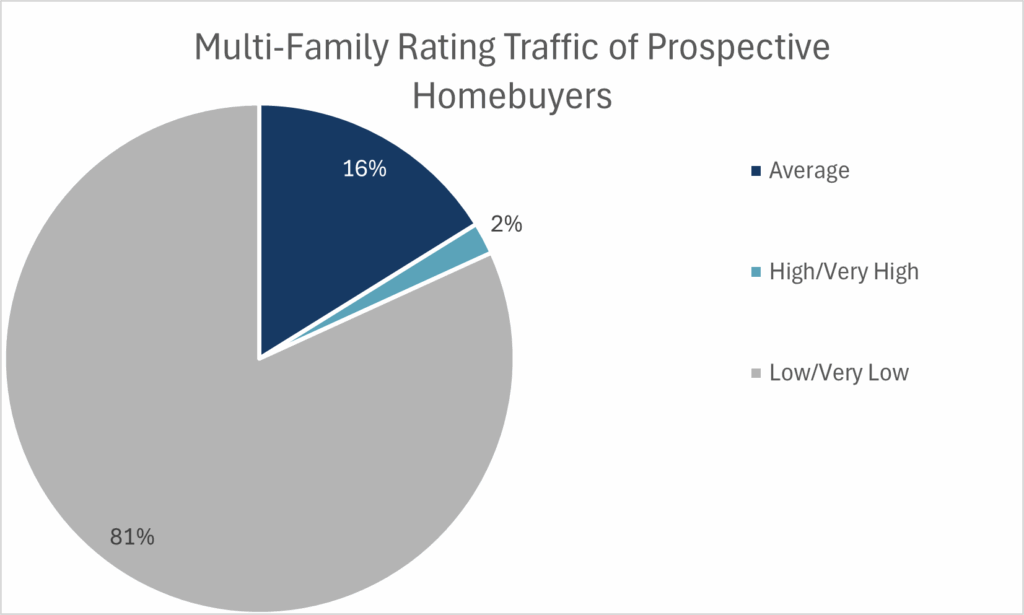
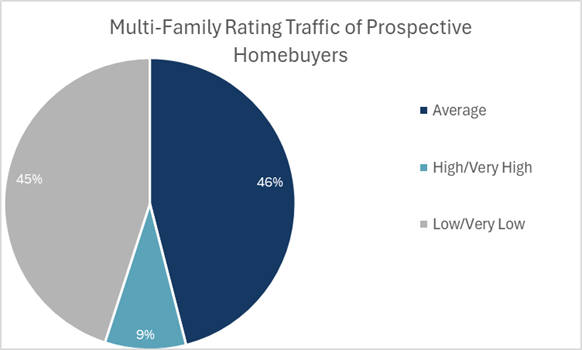
- For the first time, there was no multi-family builder in the sample that rated the sales office traffic or pace of inquiries as High/Very High.
- Regionally, the new area of concern is the Prairies, as it has been on a clear down trend from a score of 73.2 in Q2 2024 to now a score of 37.6. After Alberta broke its record for housing starts, the HMI is showing a definite slowing for the market. British Columbia’s score of 13.9 was down 10.9 points from a year ago. Ontario had the weakest score, at 3.8, and its multi-family HMI has remained in single digits since the end of 2024—a complete collapse of the market.


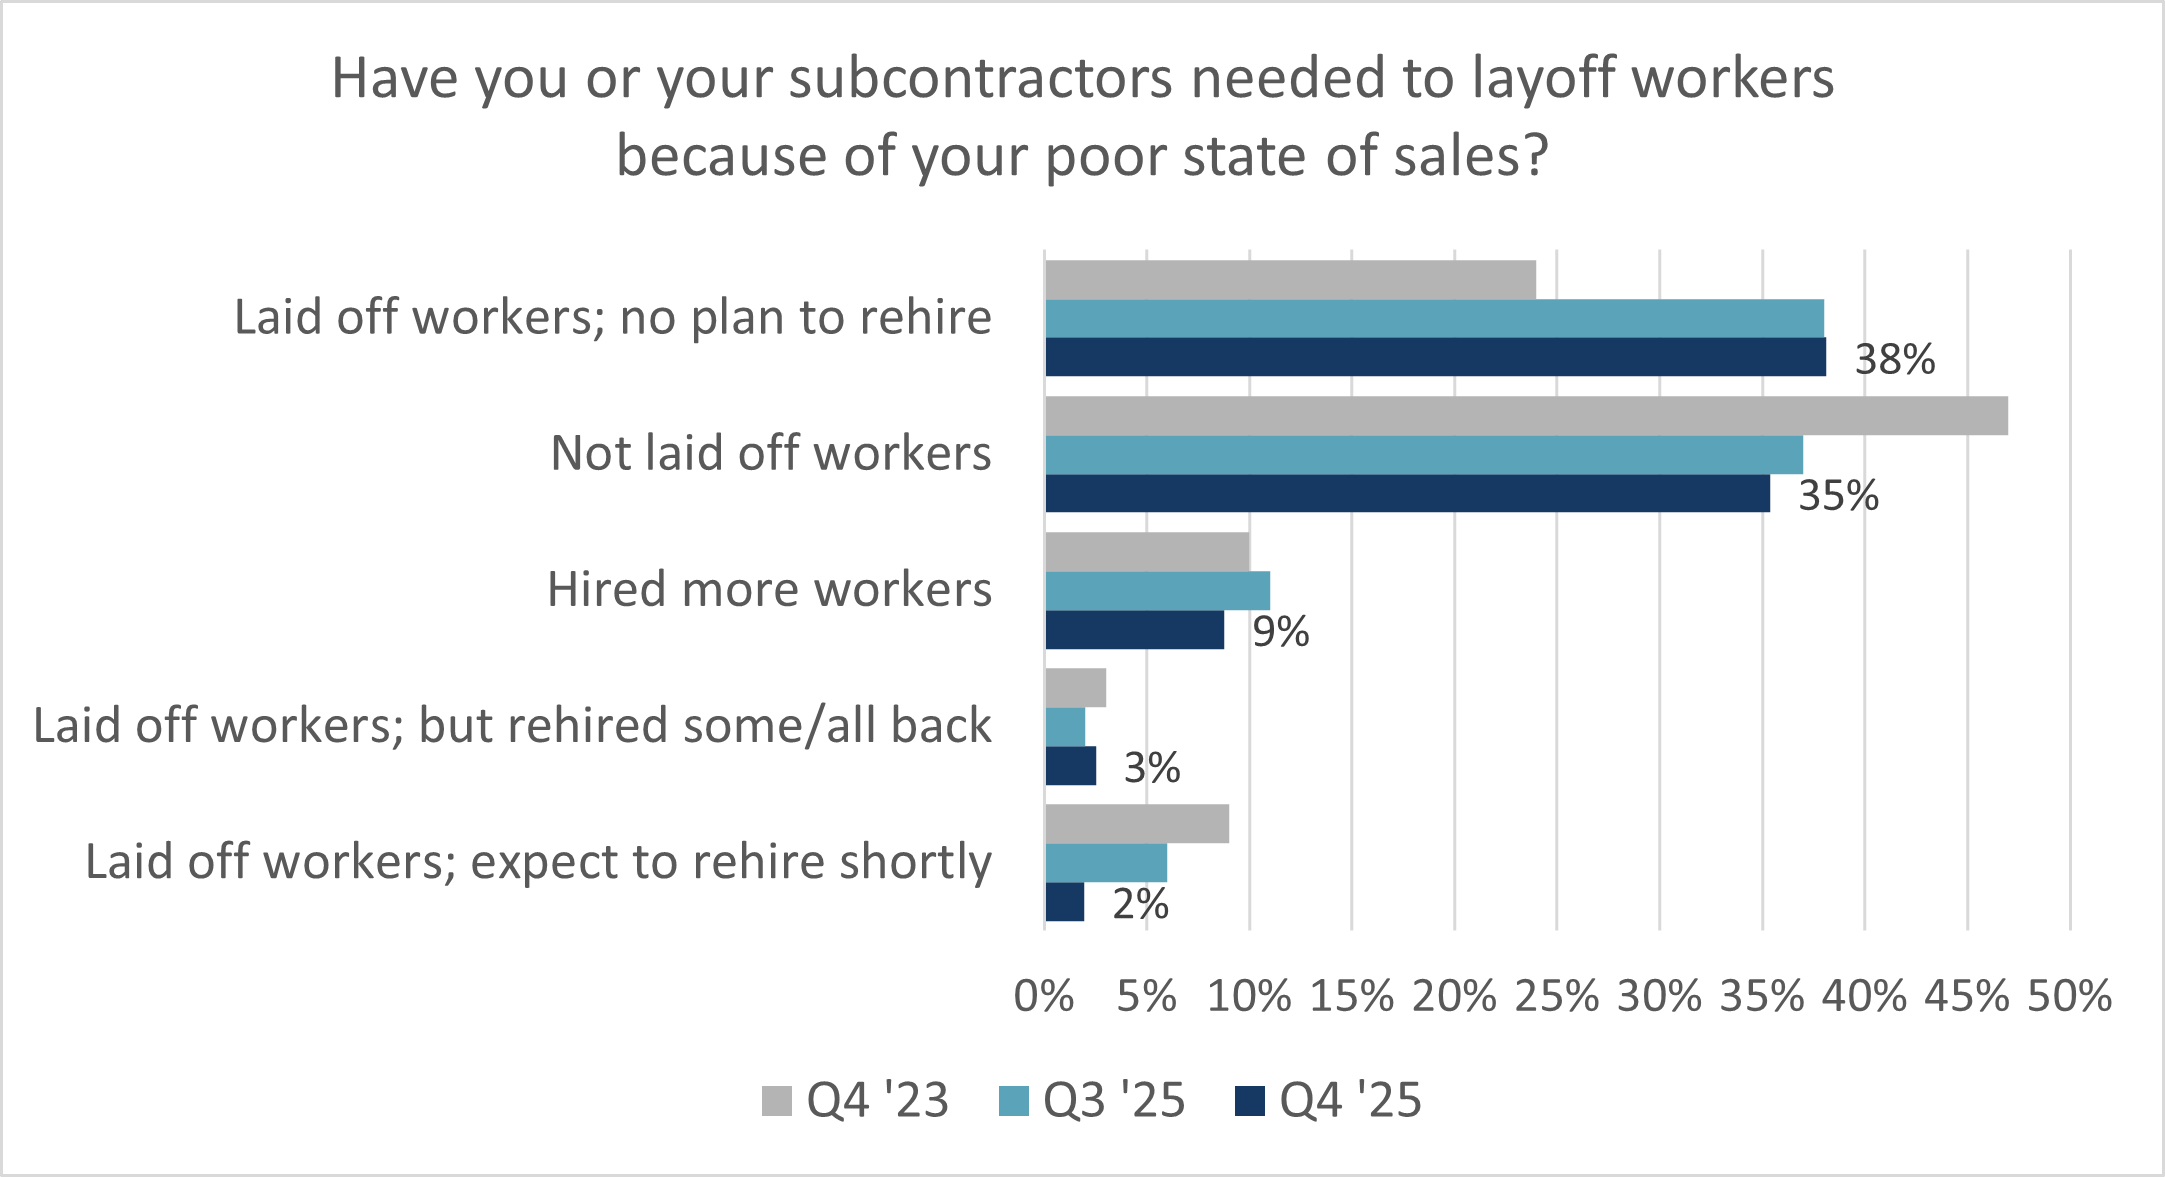
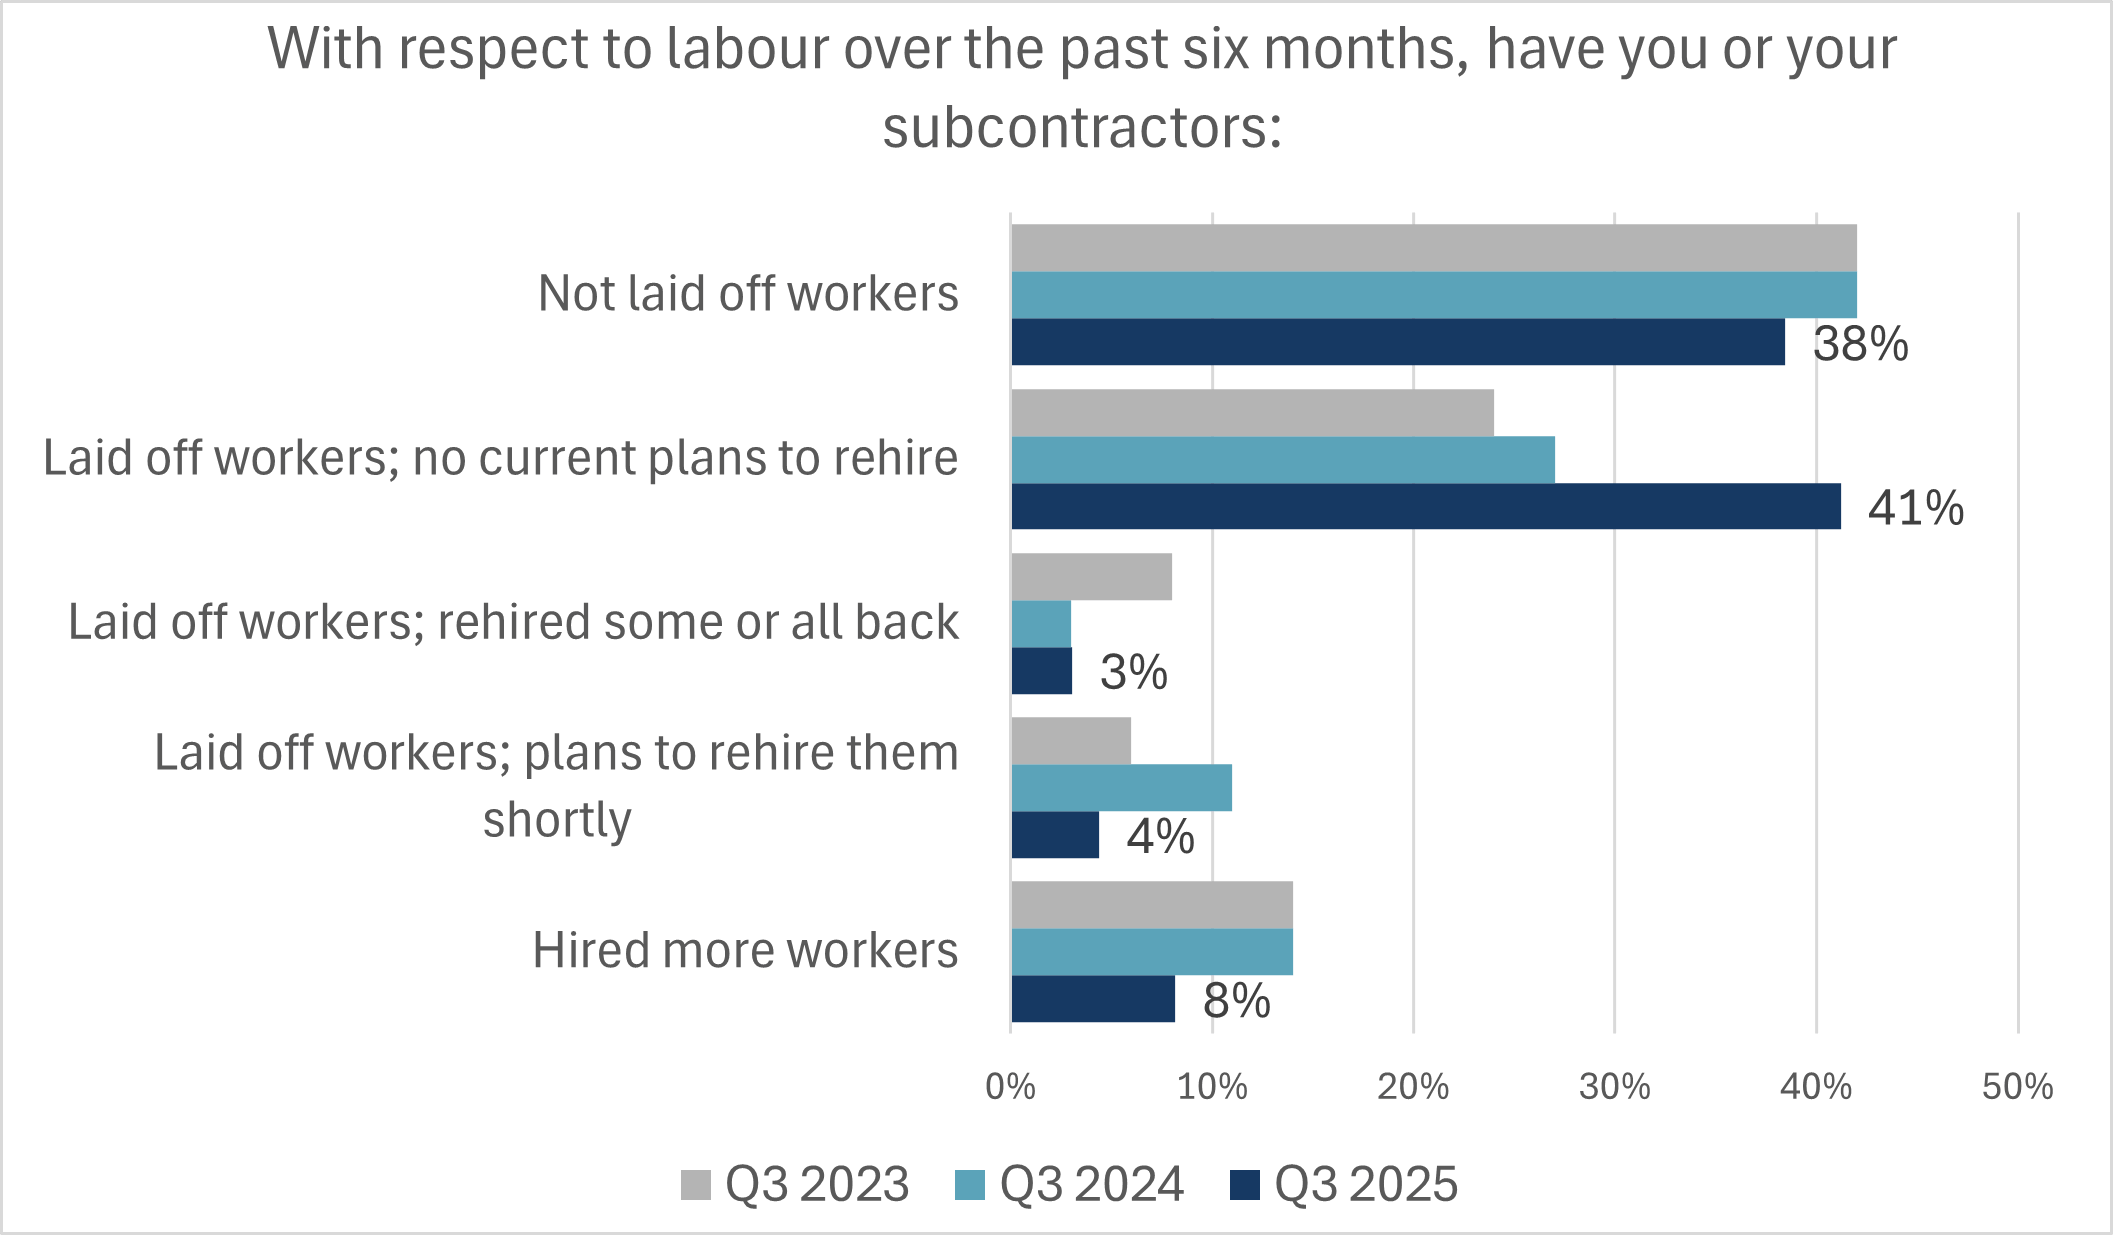
- Given that Statistics Canada does not produce employment statistics that separate new home construction from renovations, CHBA continues to gauge the breadth of layoffs done by builders or their subcontractors. The proportion of builders that reported layoffs, with no immediate rehiring plans, rose 9 percentage points from the previous quarter to 47%. Meanwhile there was little changed in the proportion saying they had not laid off workers.
- In Ontario, 65% of builders reported layoffs over the past year, while 21% said they had not. Last quarter, 53% of Ontario builders having to layoff workers, while 29% said they had not. This is what is driving the increase in the national proportion of builders reporting layoffs
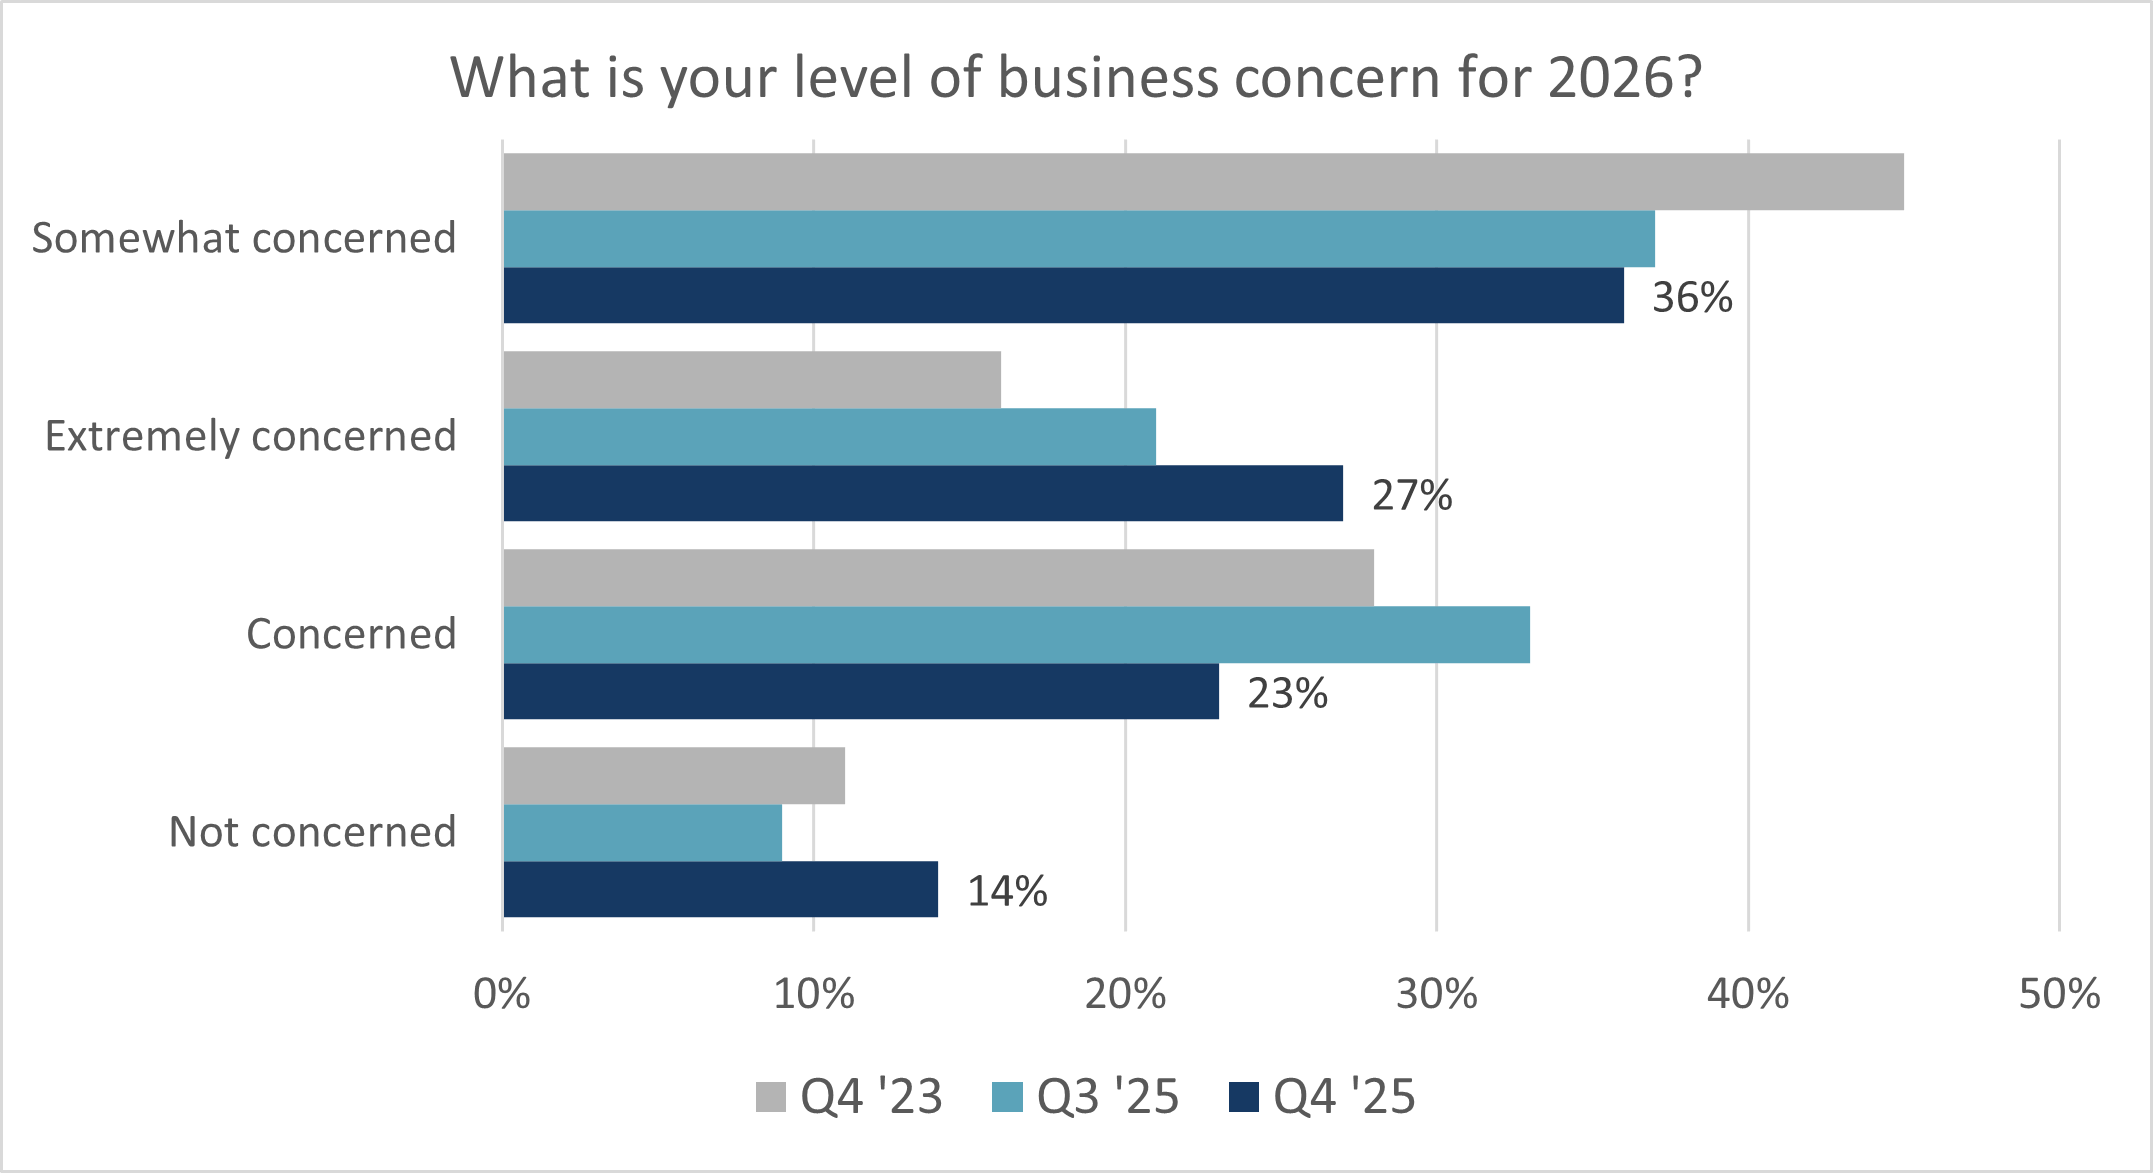
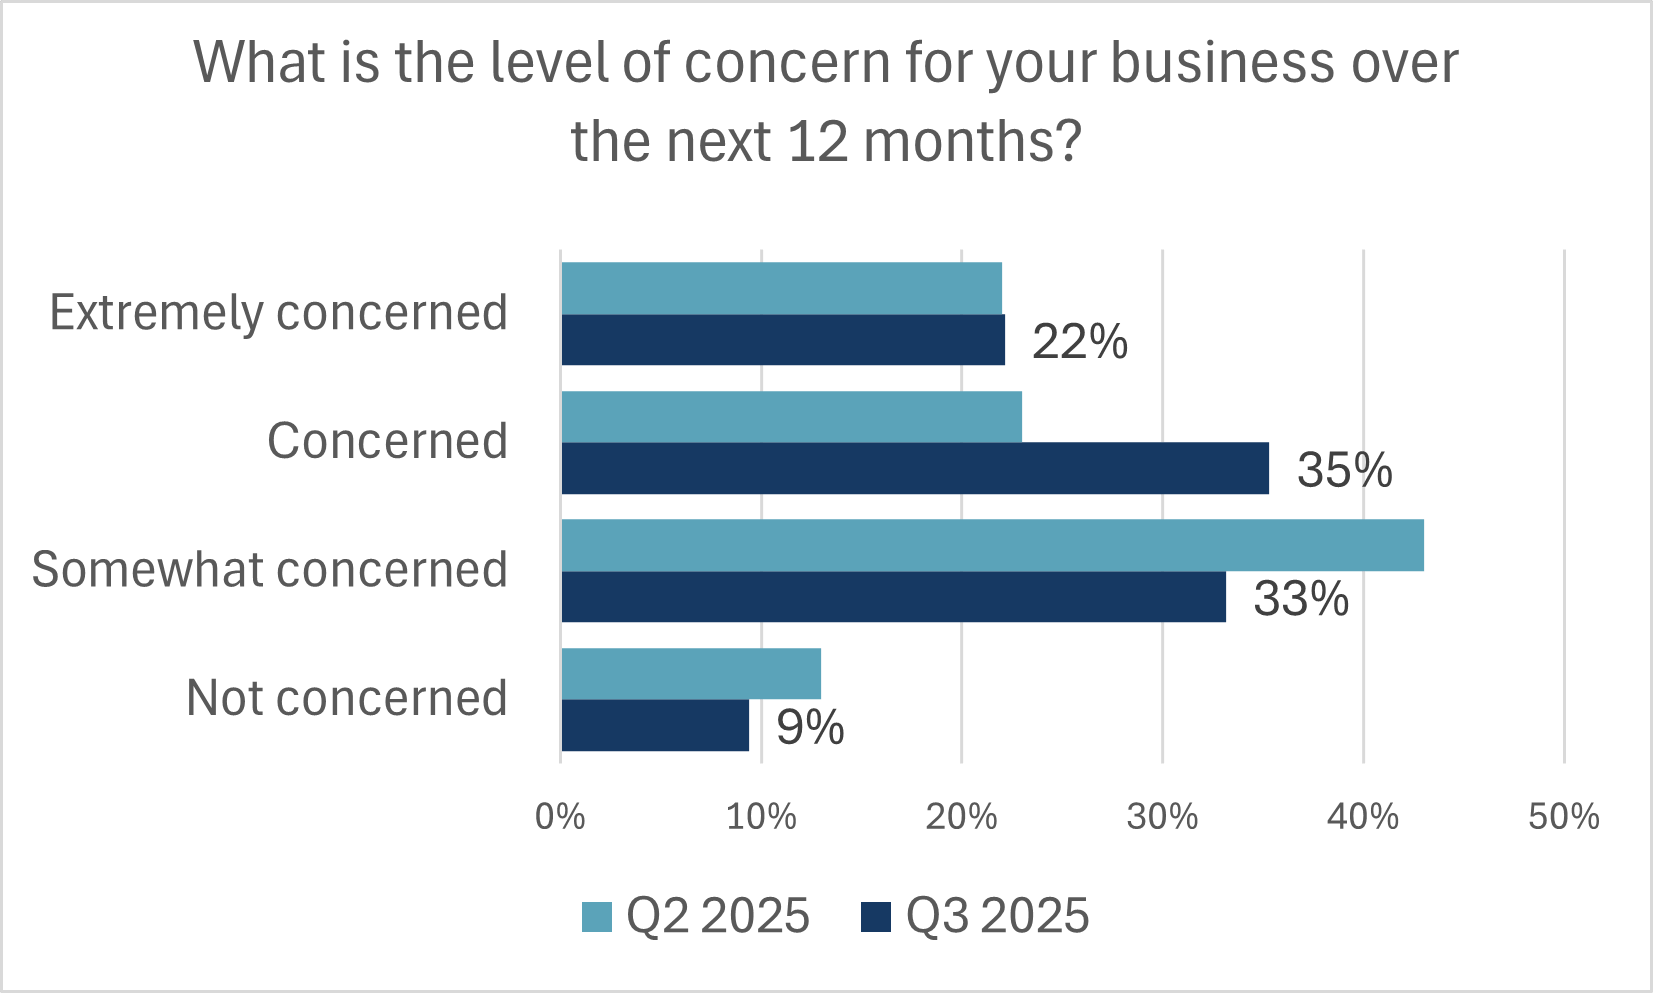
- Builders were also asked again about the level of concern they have for their business over the next year. The overall anxiousness has grown substantially even between Q4 2025 and Q1 2026, with 88% of builders concerned now for their business. Both the proportions of builders that are concerned and extremely concerned grew.
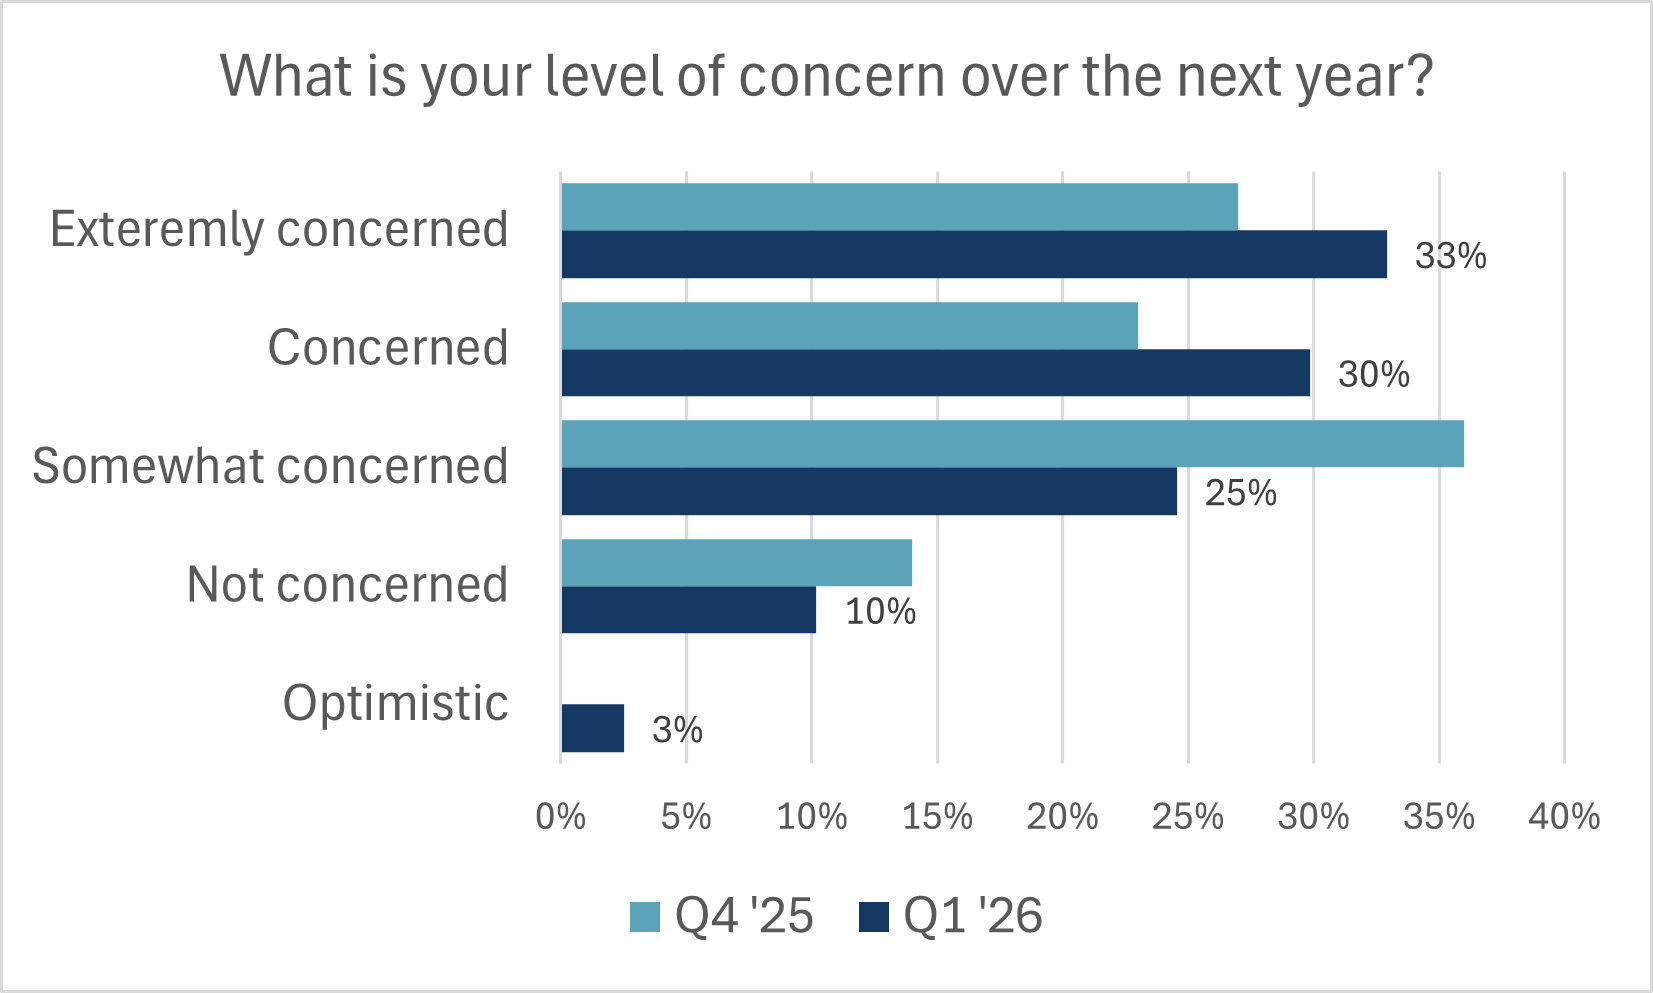
- Out of the builders that responded as concerned or extremely concerned, very few reported a serious risk of bankruptcy. This speaks to the structure of site-built builders and the industry that can fluctuate with market demand conditions (which is harder for CHBA’s factory-built members, with higher overhead and more of a need for steady through-put, per CHBA’s Sector Transition Strategy). That said, the current market conditions are at risk of reducing the industry’s future capacity, due to worker layoffs and industry exits.

- These same builders commented that demand isn’t necessarily weak, it’s that there is a fundamental mismatch between the cost of construction and the prices that homebuyers can qualify for. The overwhelming view is that pre-construction approval processes, development charges, and delays have compounded to a point where they cannot deliver housing where it is demanded.
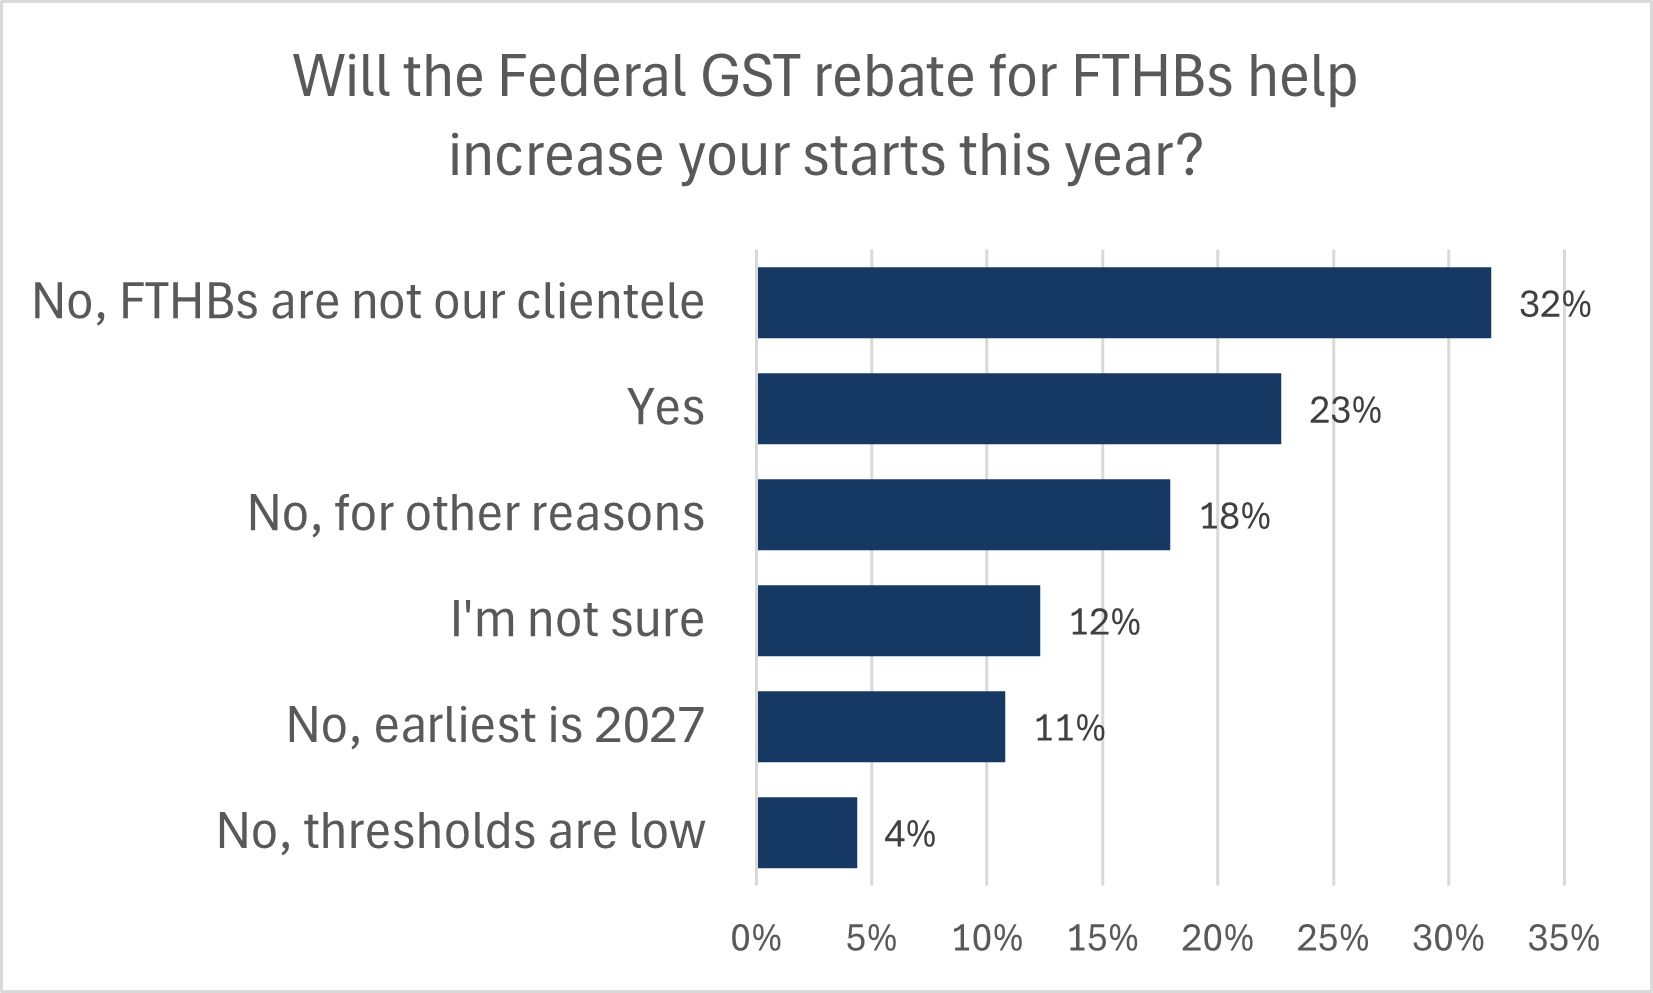
- When asked about the effect of the first-time home buyers GST rebate, only 23% said that this would help raise their number of housing starts in 2026.
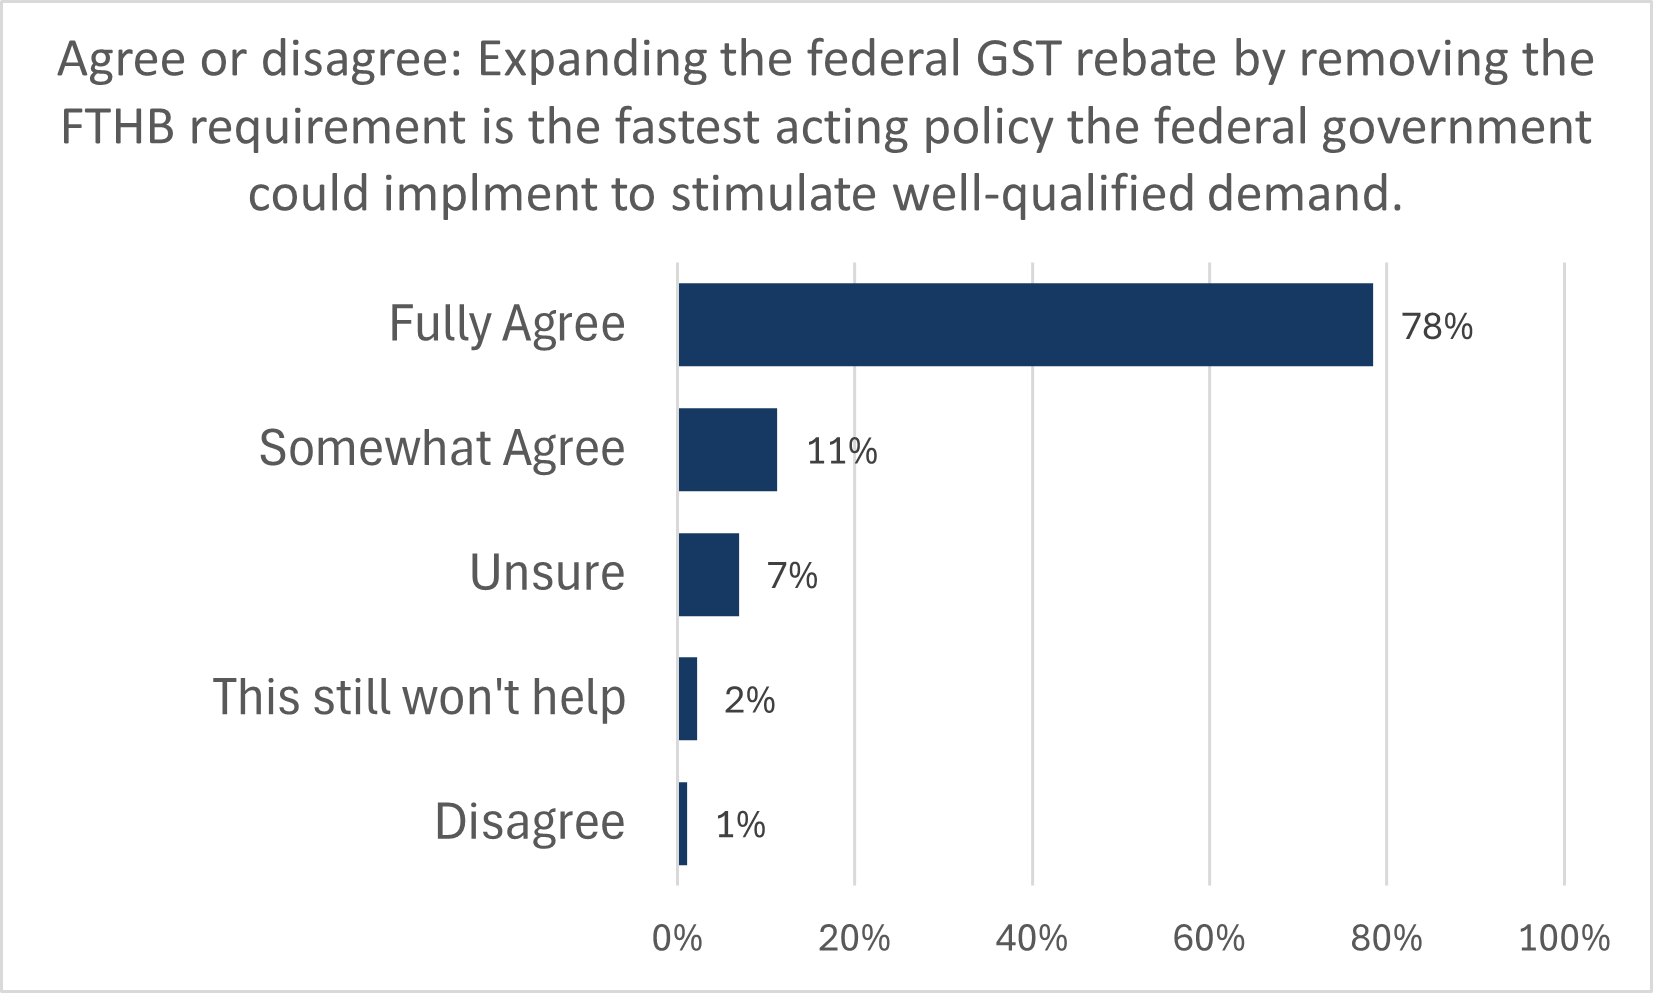
- Following up, builders were asked if they agree that expanding the rebate to all buyers would be the single fastest acting policy the federal government could implement to stimulate well qualified demand for new housing. 89% agreed with this statement.
- According to respondents, non-lumber material prices to build a reference 2,500 sq ft detached home rose by $42,000 over the past year alone. When combined with the change in lumber prices, since the start of 2020, the national average material costs alone for a 2,500 square foot home have risen by $109,500.
An explanation of CHBA's methodology for the HMI is below.
Conducted on a quarterly basis, the CHBA survey asks an expert panel to rate market conditions for the sale of new homes at the present time and in the next six months as well as the traffic of prospective buyers of new homes. Each variable allows the respondent to rate conditions as either “Good”, “Fair” or “Poor” or in the case of the traffic of prospective homebuyers “High/Very High,” “Average,” “Low/Very Low.” Each of these three variables creates a component index and the HMI is an average of the three component indices:
Component Indexᵢ = (% of Good responsesᵢ - % of Poor responsesᵢ +100)/2
HMI = 0.6xPresent + 0.1xFuture + 0.3xTraffic
The final number is weighted to ensure it is representative of CHBA’s membership by geographical location. The provincial weights leveraged 2024 Statistics Canada housing starts data for the breakdowns of single and multi-family markets to create the proportions of the single-family and multi-family markets in each province. This allows CHBA to create an accurate provincial representation while also taking into consideration that each province has very different single-family and multi-family proportions. Each local Home Builders’ Association (HBA) is also weighted to ensure proper representation by builder size (I.e., small/medium and large). In some cases, where local breakdowns for HBAs are not available, those HBAs are not weighted. The provincial weights are developed in a way to ensure the sample size is representative of the overall population of CHBA's membership of builders. The special questions presented above are only weighted at the provincial level.
For the Q4 2025 results, an online survey was conducted by CHBA from March 24th to April 10th 2025, using CHBA's panel of builders. Some builders elected to speak to both the single and multi-family builds.
CHBA’s HMI is modelled on that of the National Association of Home Builders (NAHB) in the US. The NAHB-Wells Fargo Housing Market Index is based on a survey of single-family builders that the NAHB has been running every month since 1985. CHBA is leveraging the NAHB's weights as the basis for CHBA’s HMI weights (see formula above). This is to ensure that CHBA is placing more weight on the Present conditions question. As CHBA collects more data, it is planning on developing weights for each of the component indices discussed above that will allow us to maximize the correlation with Canadian housing starts six months into the future.
Panel
The panel is made up of builders from constituent associations to ensure representativeness across Canada. Working together with the association’s local and provincial Executive Officers, CHBA was able to build a panel that is reflective of membership in each region. To ensure it remains up to date, CHBA is continually refreshing the panel. The HMI is weighted to ensure the panel is representative by both geographical location (i.e., national, provincial and local) and size (i.e., small, medium and large). For some smaller home builder associations (HBAs), the sample is not weighted. In those cases, CHBA leverages the HBA’s expertise to ensure the sample is representative of the region. Single-family includes single-detached homes, semi-detached homes and row (townhouse) homes. Multi-family includes stacked townhouses, duplexes, triplexes, double duplexes and row duplexes, and low and high-rise apartment buildings.
Archive
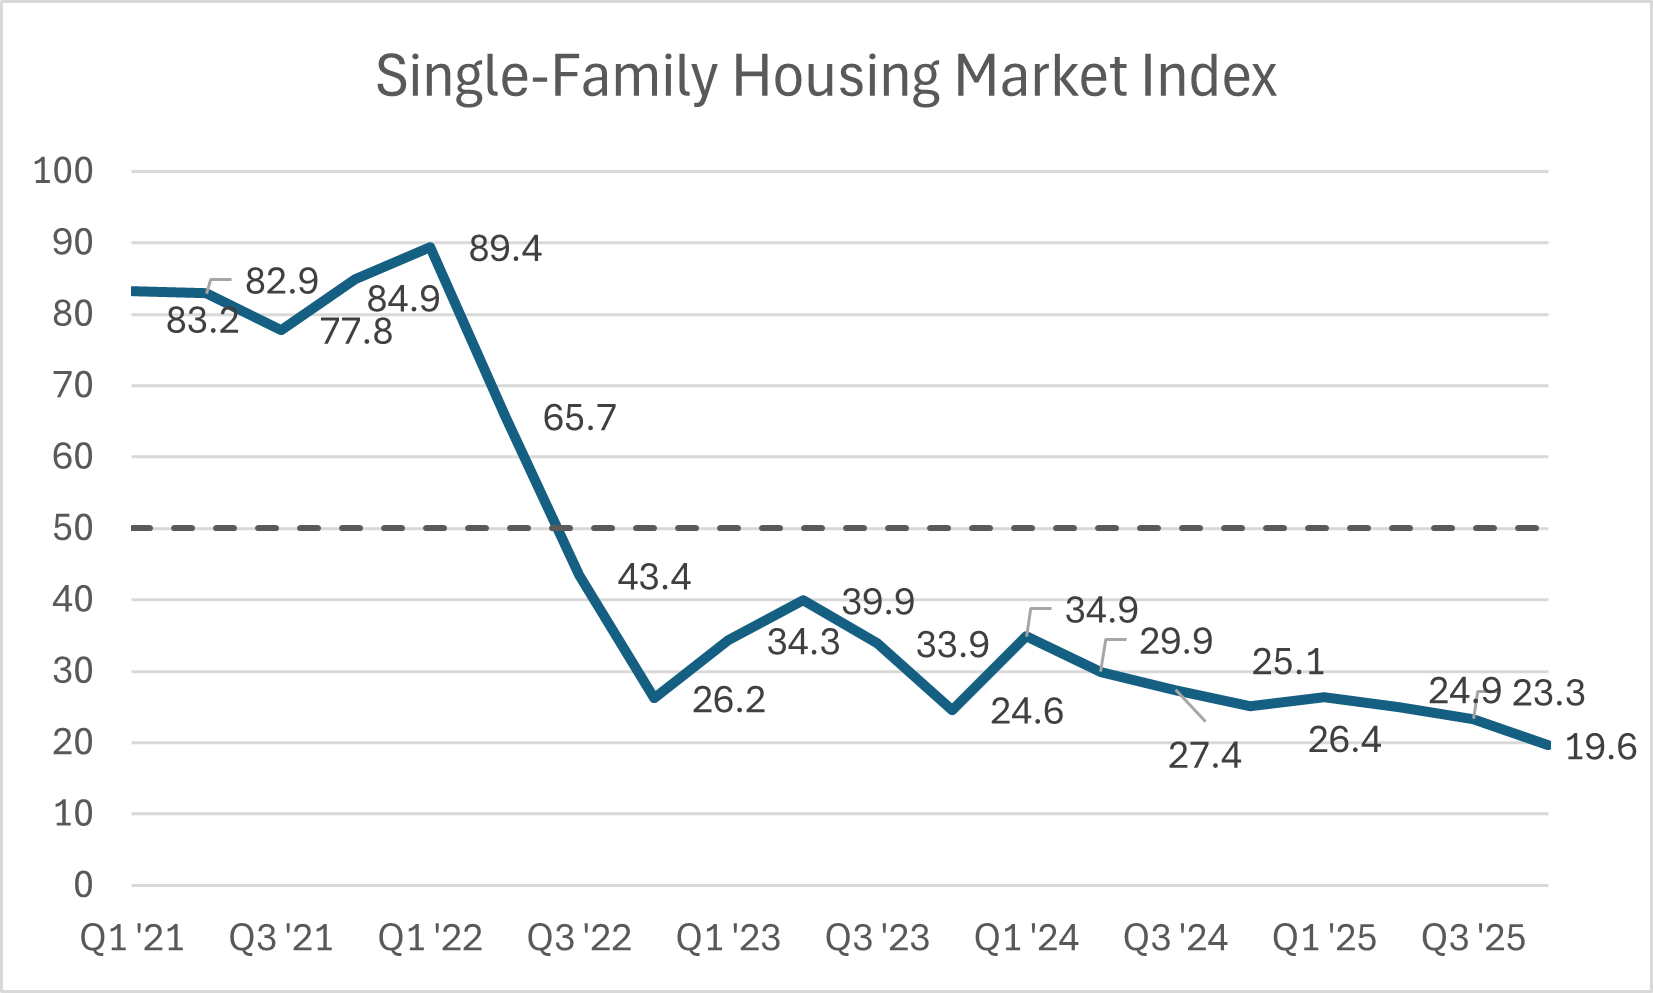
- CHBA’s single-family Housing Market Index (HMI) for Q4 2025 is 19.6, falling 3.7 points from the previous quarter and 5.5 points from Q4 2024. Unfortunately, this is the third consecutive quarter that the single-family HMI reached a new record low.
- For context, the US single-family HMI, tracked by our counterparts at the NAHB, was 38 in the final quarter of 2025.
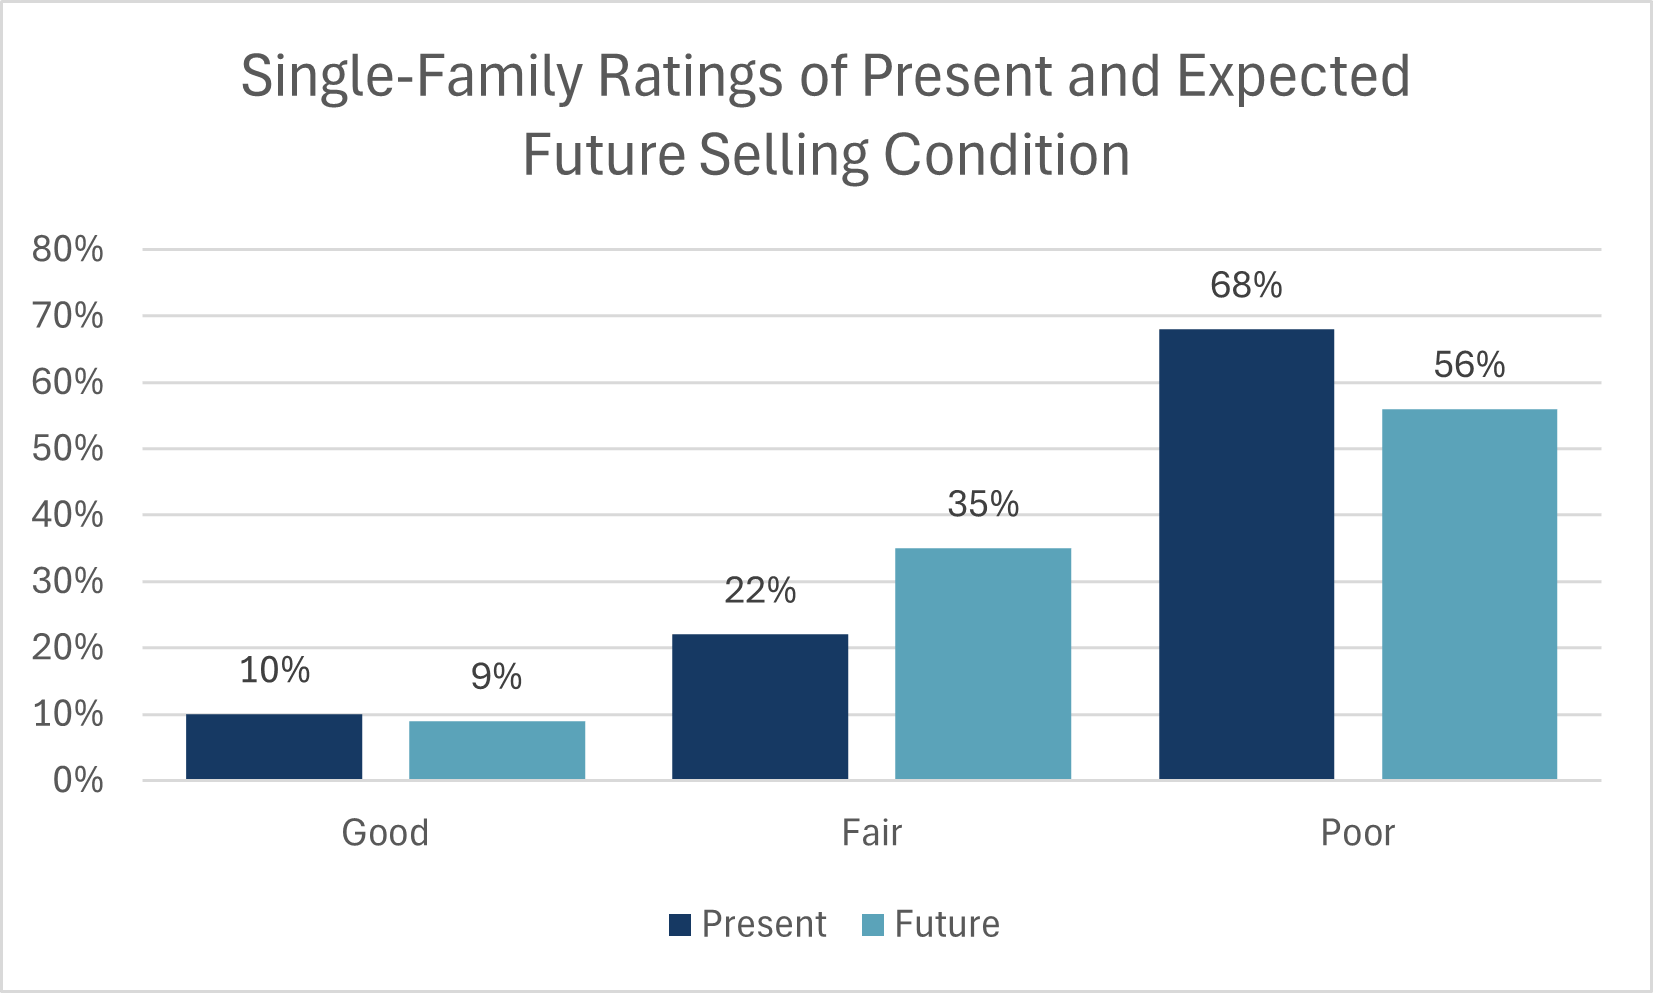
- The present conditions subindex fell to a low of 20.8 as a result of 68% of single-family builders rating current selling conditions as Poor—a record high proportion.
- Similarly, 56% of single-family builders expect selling conditions over the first half of 2026 will also be poor. In Q4 of 2024, 32% of builders expected poor selling conditions. This illustrates how the extended market decline will begin to change business decisions builders make, including staffing levels.
- Regional results continue to hold from recent quarters. Ontario’s score of 10.4 remains within a range of between 7 and 12 over the past two years. Sentiment in British Columbia continues to fall further, reaching a new record low of 7.5. Atlantic provinces remain neutral about selling conditions, with a score of 50.7. Most notably, the sentiment of 32.8 represents fresh weakness in this region. The index fell 14.3 points from the previous quarter and 15.4 points from a year ago to a level that is clearly now in pessimistic territory.
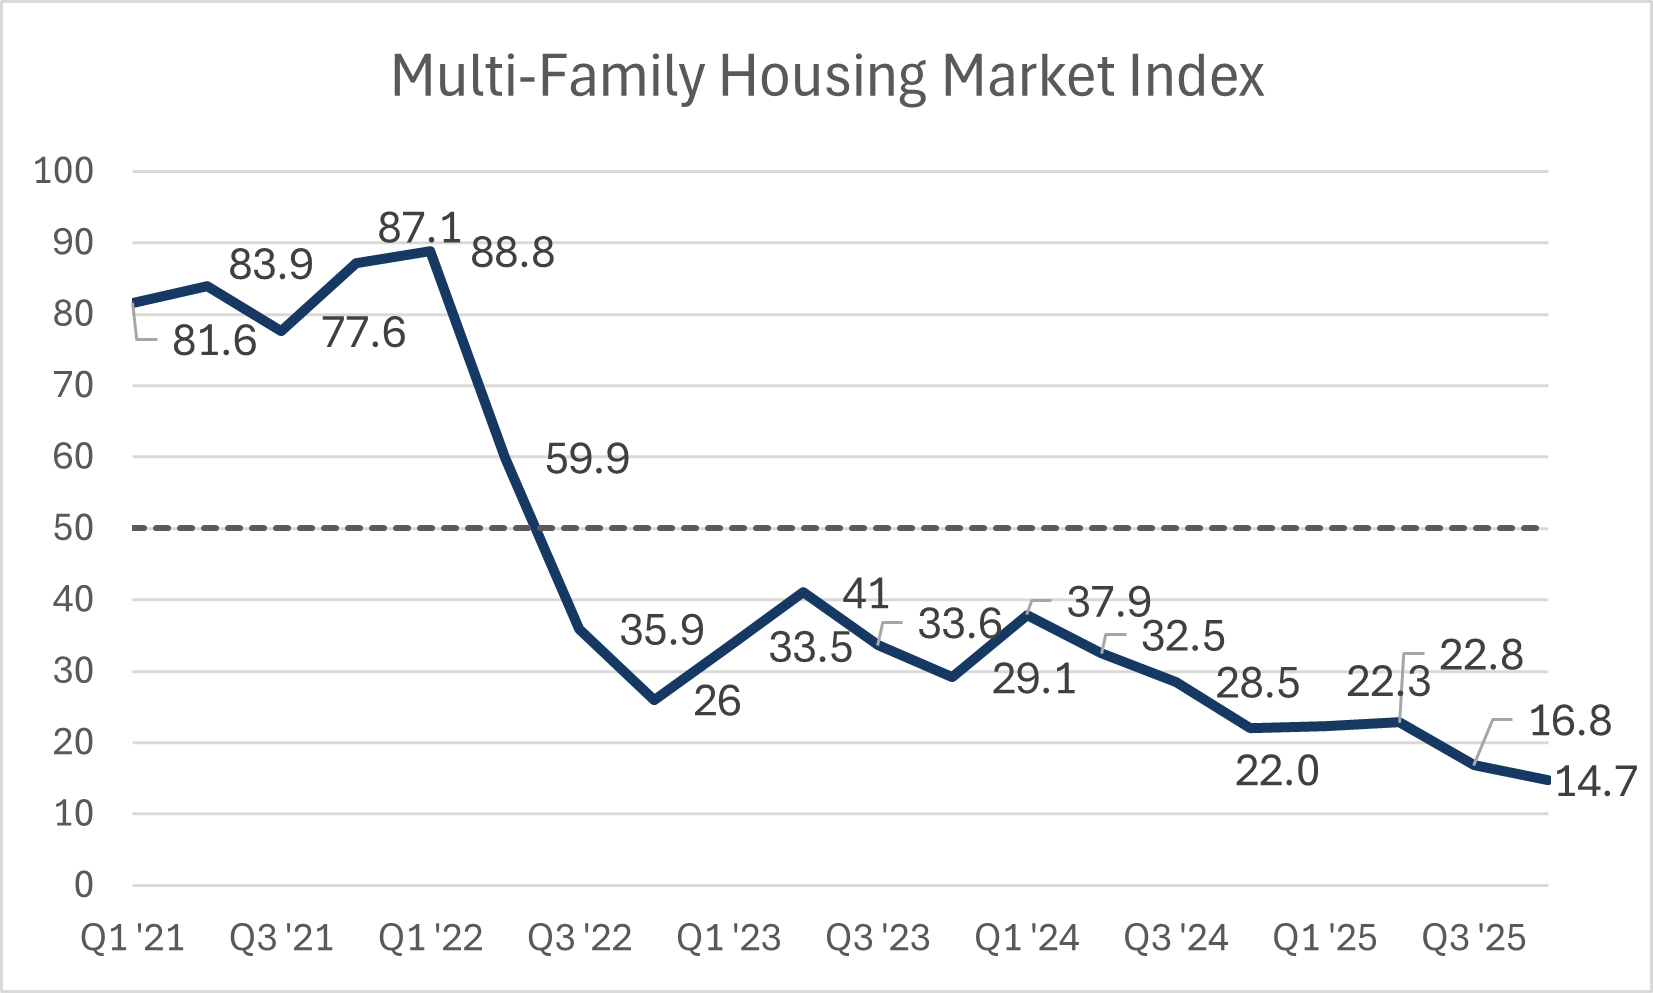
- The multi-family Housing Market Index in the final quarter of 2025 was 14.7. This is a new record low, surpassing the score of 16.8 from the previous quarter. Regional strength had previously kept the index from falling below 20, however, falling sentiment in the Prairie provinces has reduced this support.
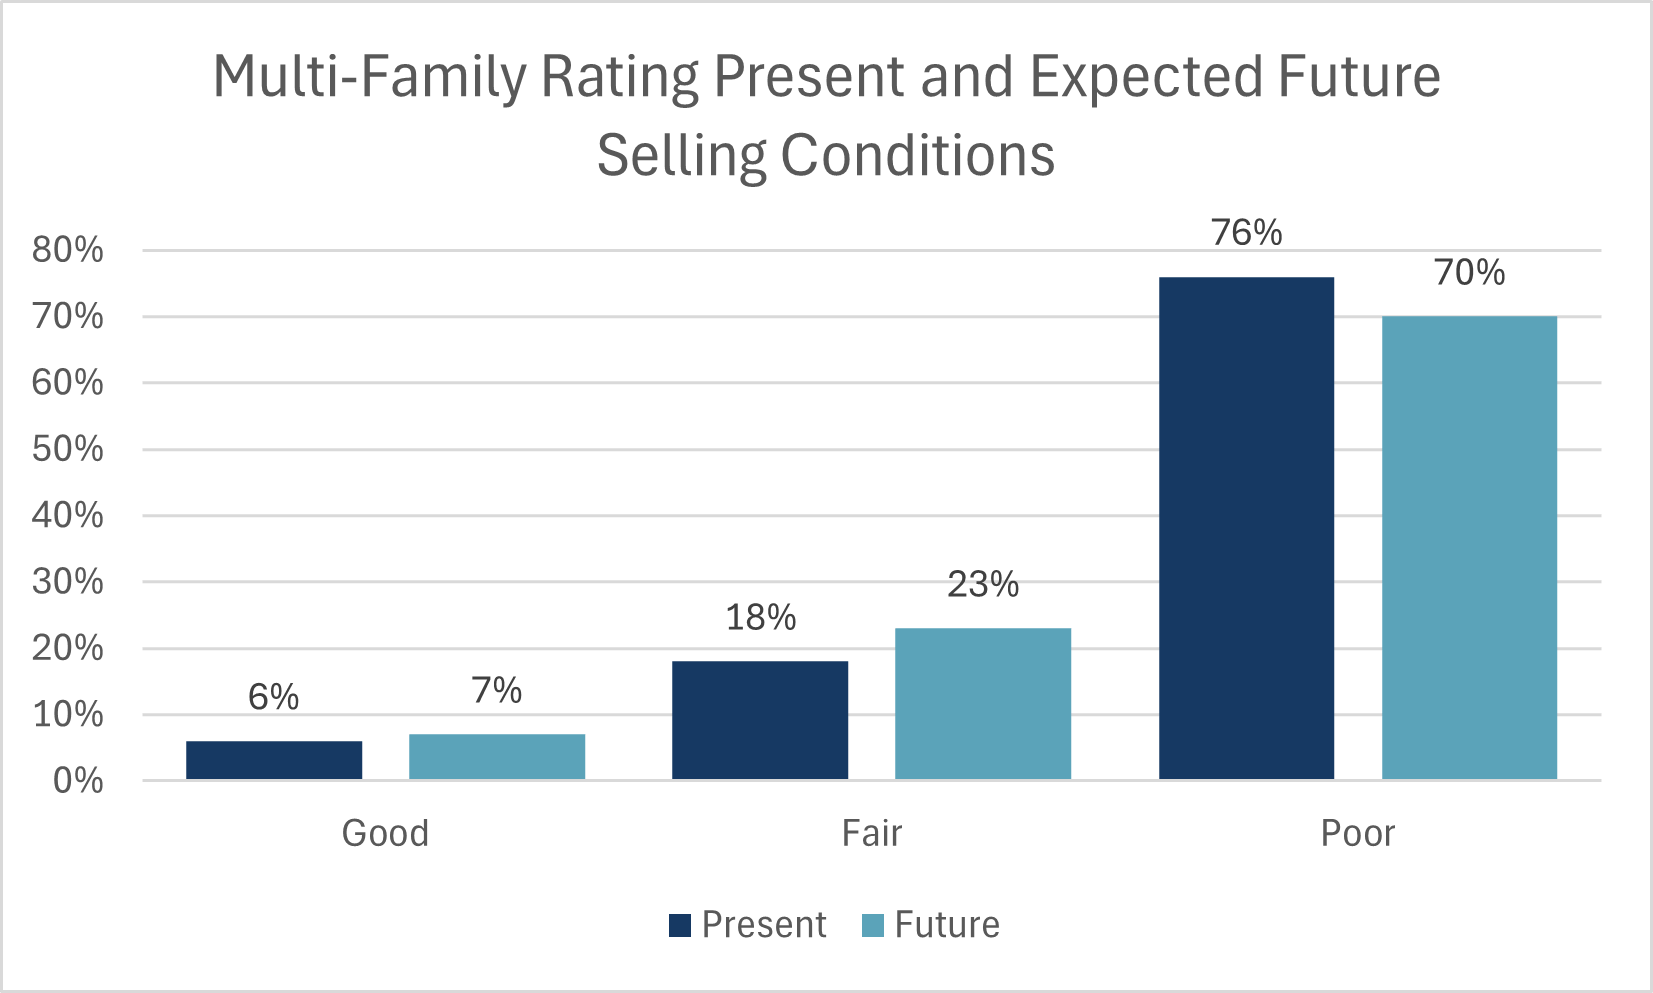
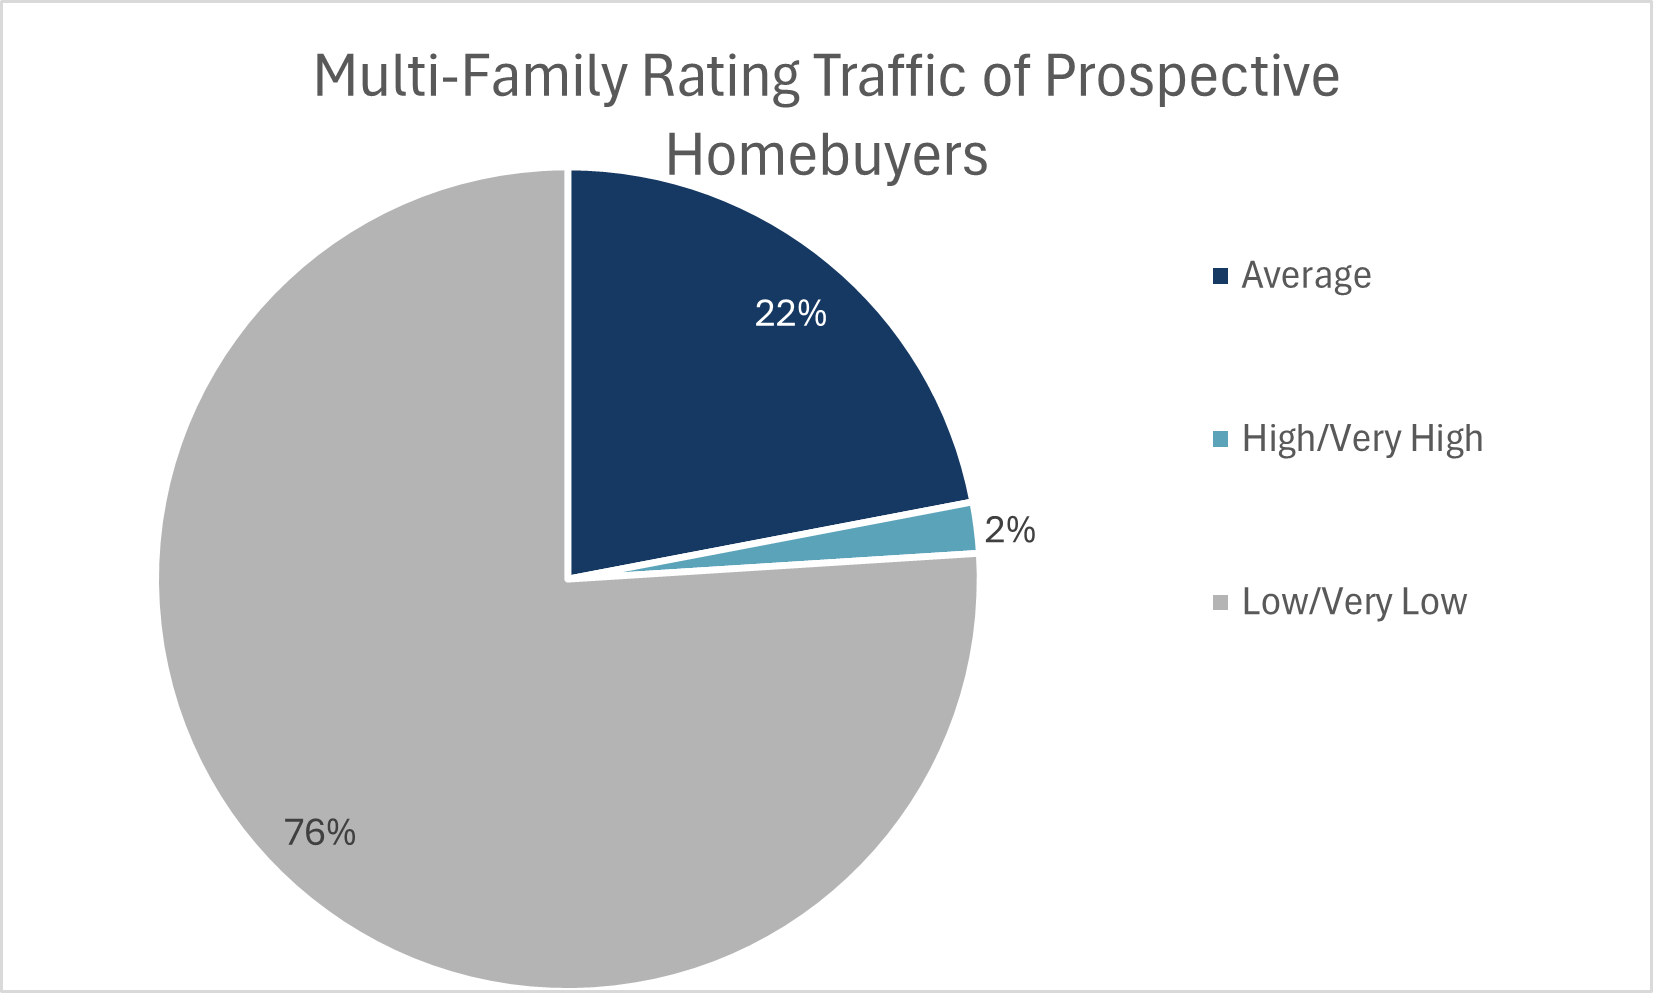
- A record 76% of multi-family builders state that current selling conditions are Poor. In the previous four quarters, an average of 63% of builders considered current conditions as Poor. This increase was the main reason why the latest HMI reading set a new record low.
- 70% of builders expect near-future sales to be Poor as well. Up until Q3 2025, there was a healthy contingent that believed that sales would recover back towards Average conditions. However, under the extended 2 and half years of weak sales, builders no longer hold this level of optimism for an improvement.
- Regionally, multi-family builder confidence in Ontario is as negative as it realistically can get, with a score of just 2.5. The province has been on a slow decline from a score of 26.1 in Q3 2023. British Columbia remains not far behind, with an abysmal HMI score of 11.9. As alluded to above, multi-unit sales conditions in Prairie provinces continue to erode, falling from a recent peak of 73.2 in Q2 2024 to the most recent reading of 40.7—at risk of falling into the pessimistic sentiment range.
- A notable result from the Q3 2025 survey was the uptick in builders having to layoff workers. In a chronically labour-constrained industry, laying off workers is seen as a last resort. This high incidence of layoffs reported by builders continued in Q4 2025. 38% of builders stated that either they or their subcontractors have had to layoff workers due to market conditions. Zooming into Ontario, this proportion reporting layoffs increases to 53%. Additionally, a significant portion of builders commented that while they haven’t had layoffs, they would not seek to replace workers who leave.
- The annual change in payroll employees in residential construction has been negative since February 2025. While the national job loss is small so far, Ontario has already lost 7.3% of its residential construction labour forc,e and British Columbia has lost 3.7%. This is offset by modest strength in the Prairie provinces and Quebec. Without an immediate pickup in sales, employment in these two provinces will likely continue contracting throughout 2026.
- Following this uptick in layoffs is the rising builder anxiety over the future of their business. 86% of builders hold some level of concern about their business surviving over the next 12 months. 27% of builders were extremely concerned about their business, which was a marked increase from the fourth quarter from 2023, when just 16% were extremely concerned.
- Focusing on Ontario, where the HMI is near zero, 44% of builders say that they are extremely concerned for their business and only 9% don’t not hold any concern.
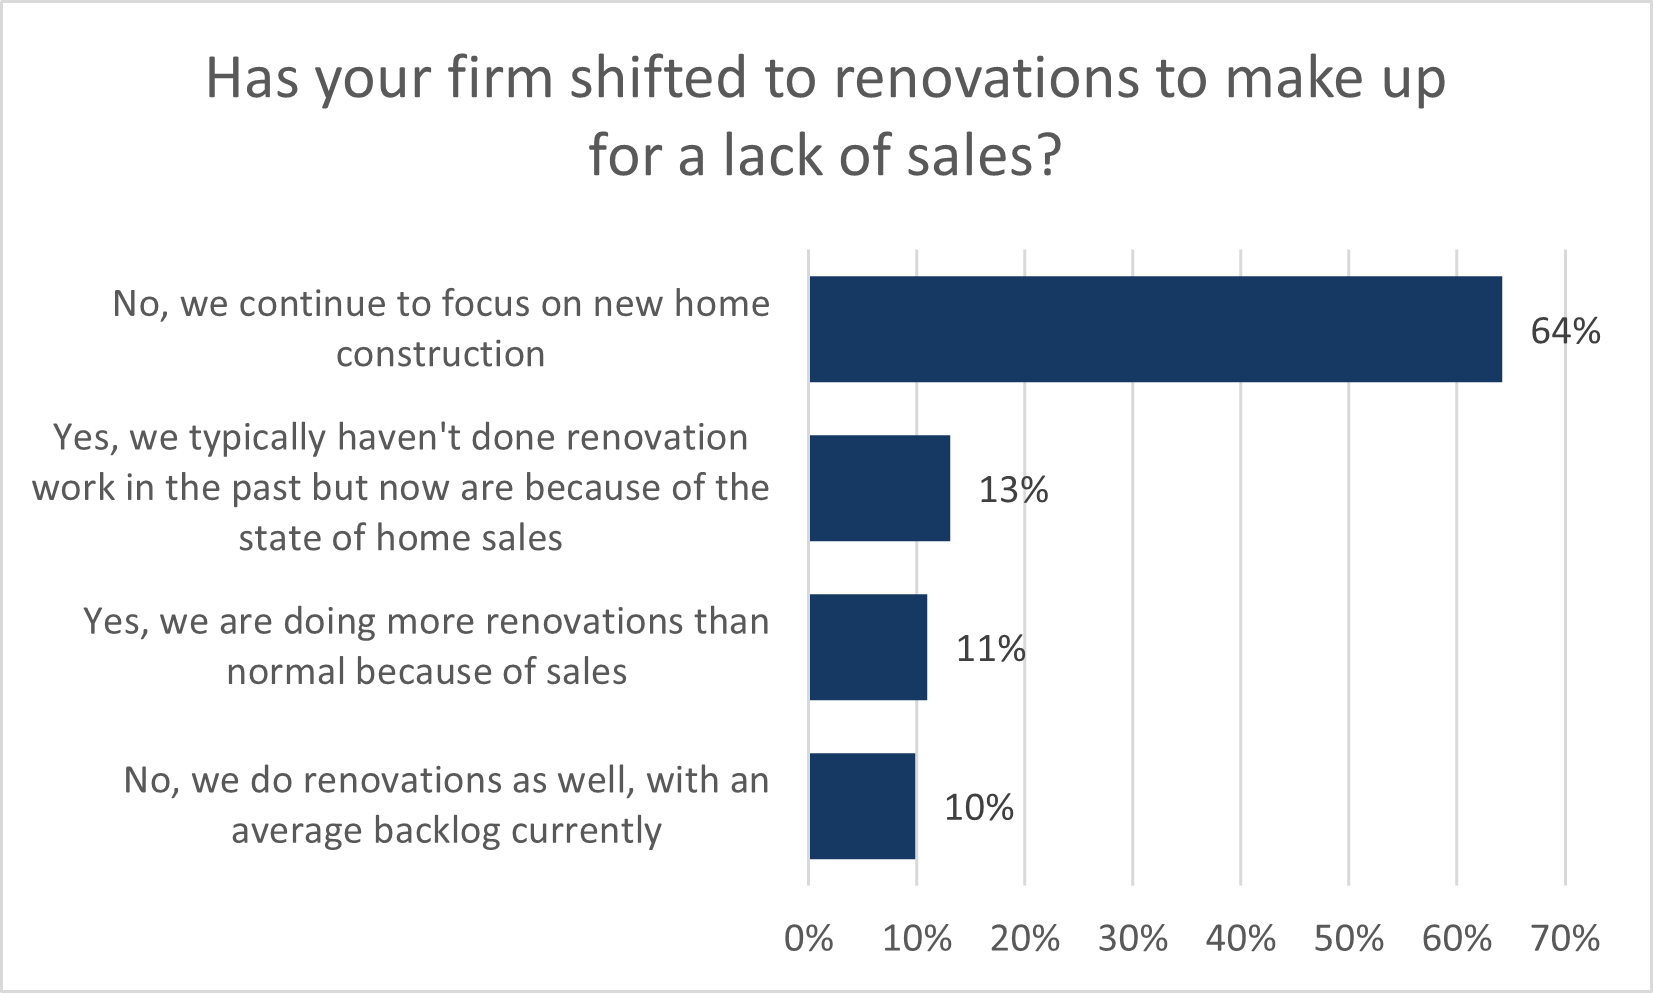
- In past survey, a significant proportion of builders stated that they are or are looking at developing rental units due to the state of sales. This quarter, builders were asked if their firm has taken on more renovation projects due to the state of sales. A combined 24% stated that they have begun competing for renovation work or taken on more renovation work than they typically do as a result of the current lack of sales. This is dependent on the size of the firm, with large production builders most often stating that they remain focused on new home construction.
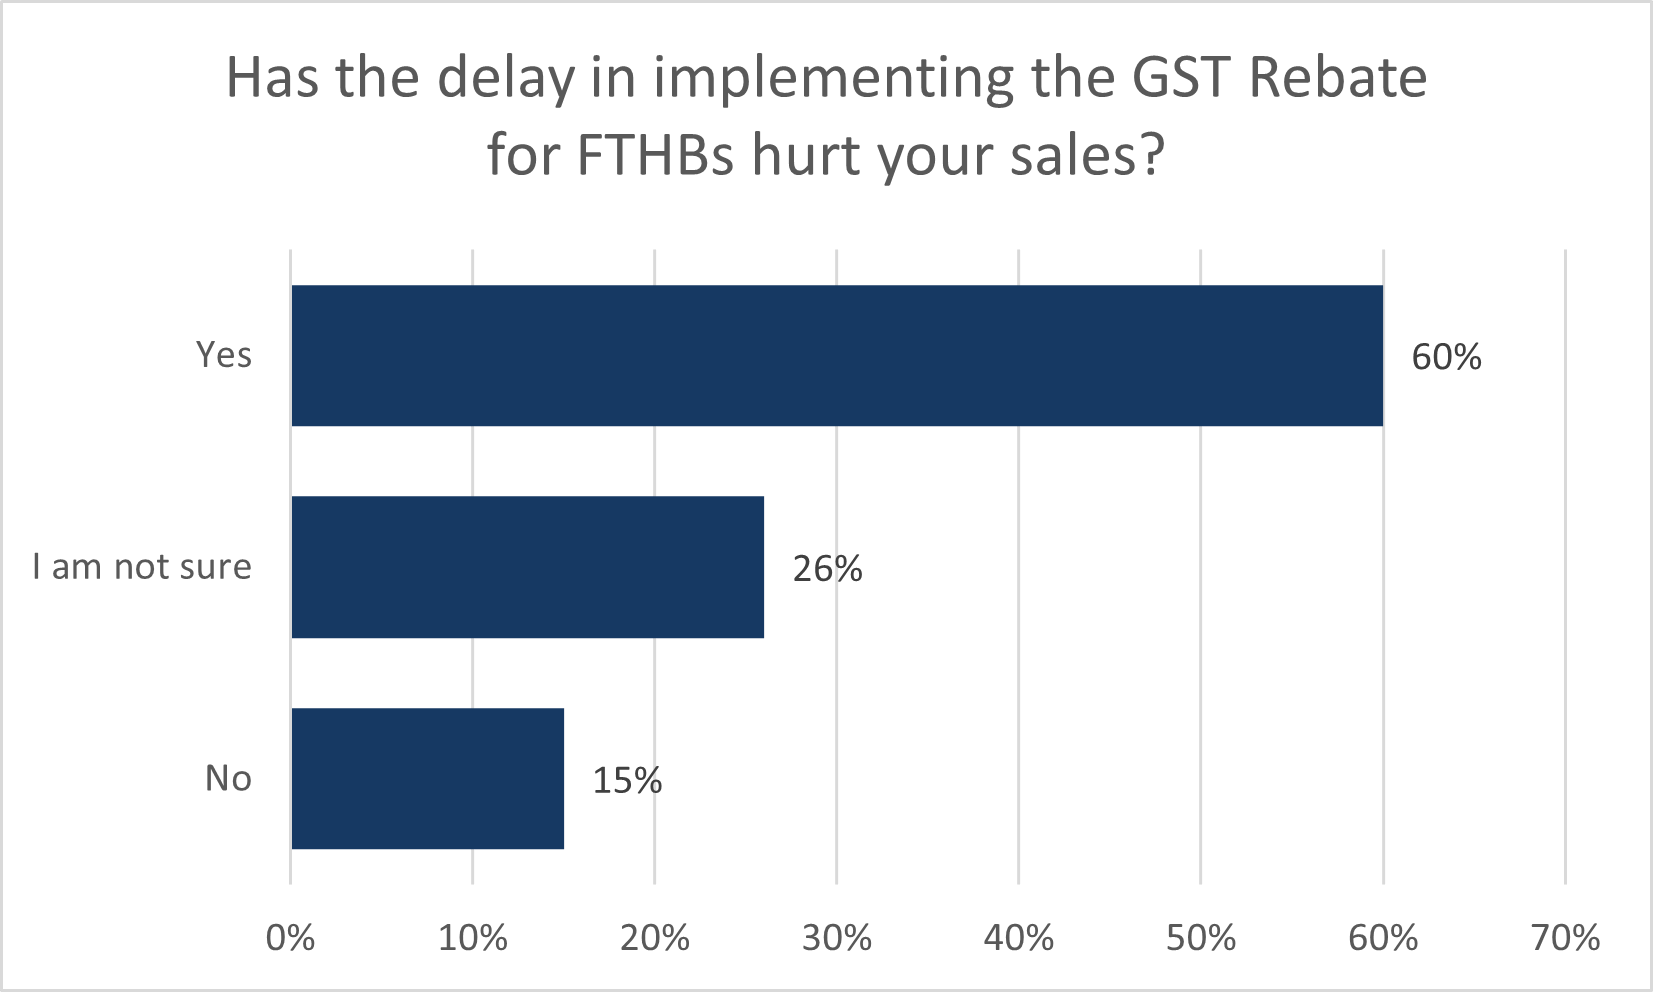
- Despite its introduction in March 2025, buyers still cannot apply for the first-time buyer GST Rebate as of January 2026. 60% of builders said that the delay in passing Bill C4 hurt their sales over the year.
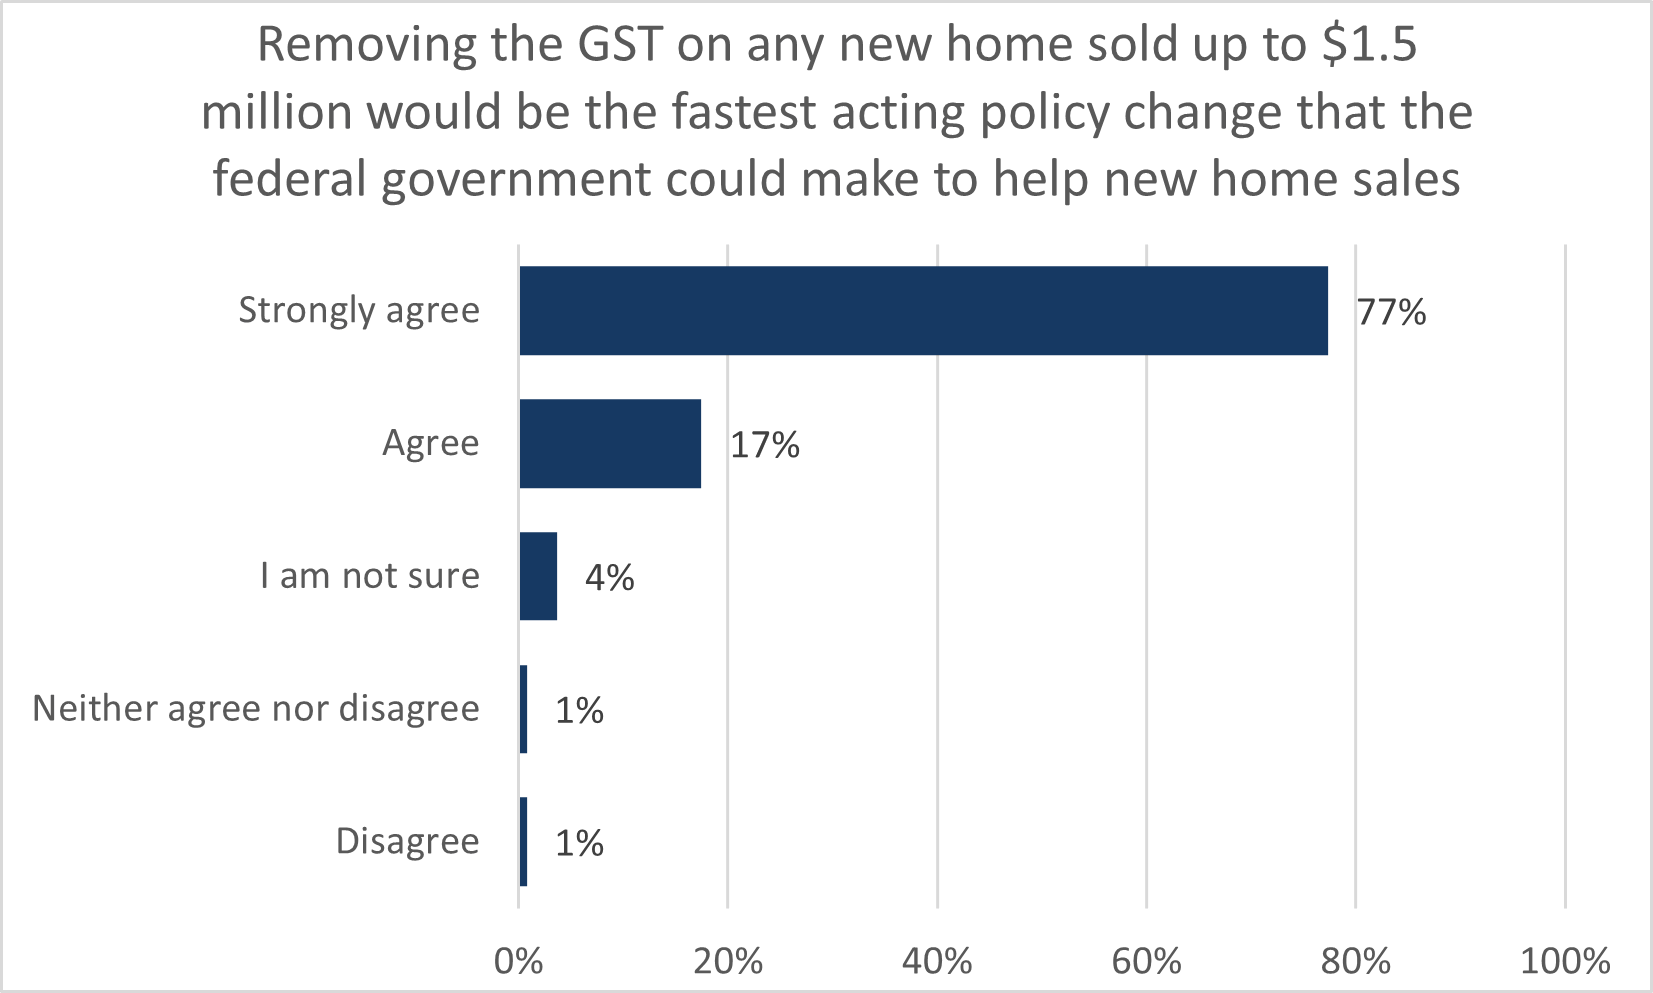
- Given that most new home buyers typically are not eligible for the first-time buyer rebate, builders were asked how effective this rebate was extended to all buyers. 95% of builders agreed (77% strongly agreed) that with the notion that removing the first-time buyer requirement for this rebate of the federal portion of GST would be the single fastest-acting policy the federal government could introduce to help improve new home sales.
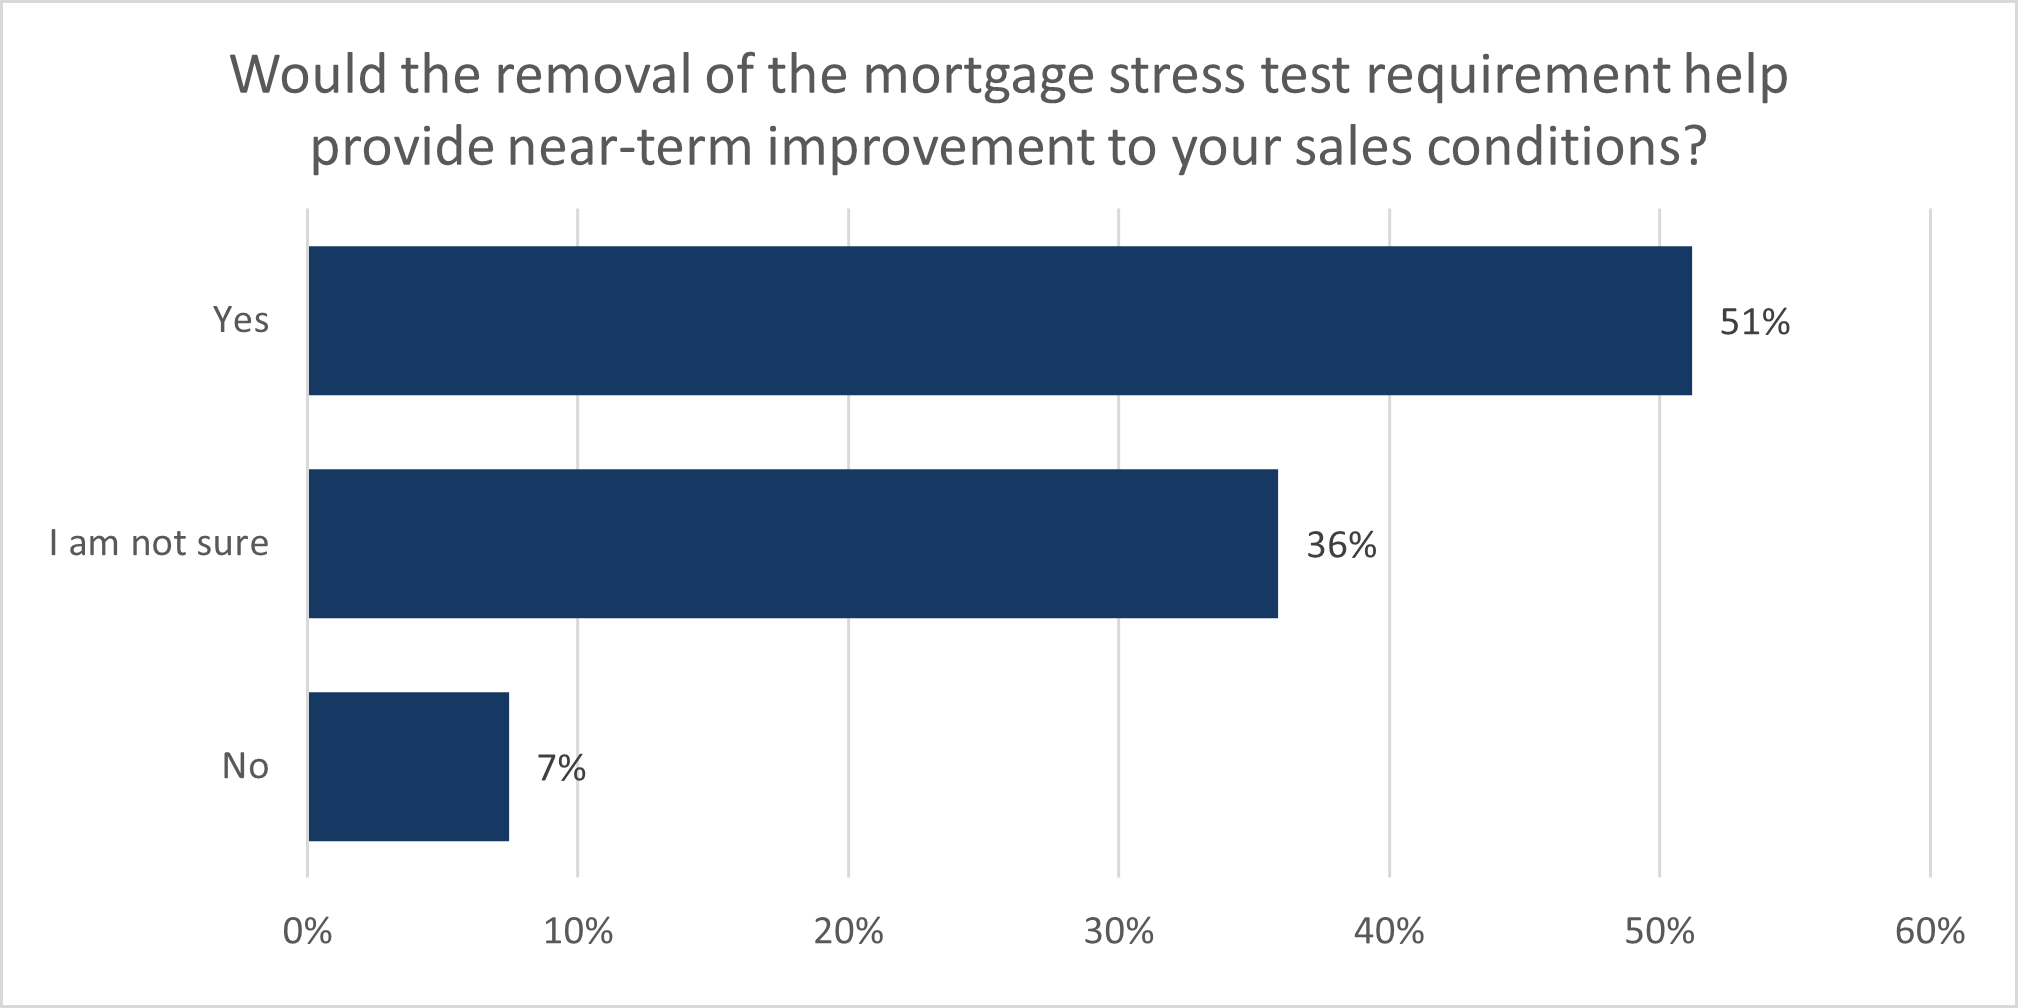
- Through 2025, OSFI limited lender approvals of mortgage loans of 4.5 times the borrower's income. In response, CHBA believes a balanced approach would be to remove the mortgage stress test in its current form. 51% of builders stated that the removal of the stress test would provide a near-term improvement to their sales. Interestingly, 36% stated that they were not sure, which is reflective of current conditions being so bad that that alone would not be the silver bullet to improving affordability. This reinforces the need for comprehensive policy change in many areas, including but not limited to the stress test.
- With increased complexity in building codes, municipalities have increased their reliance on structural engineering reviews to ensure that builds meet code requirements. This quarter, builders were asked to estimate the percentage increase in engineering costs over the past 5 years. Builders generally reported that the prices charged from engineering firms and consultations have increased reasonably, but significantly due to the new requirements. Overwhelmingly, it is the municipalities increasing the number of engineering reports needed to prove code compliance and the delays in reviewing and editing these reports that are causing this soft construction cost to explode in recent years. The biggest impact to costs has been the seismic and step code requirements in BC, where engineering costs now add tens of thousands in new costs per home, and over $100,000 in higher-priced markets.
- Builders were asked if increasing their sales would be their business’ top challenge in 2026 or if a separate issue would be their top priority. An 87% majority of builders agreed that raising their level of sales remains their top priority heading into 2026. Many of the 13% of builders stating other priorities still specified that their top challenge would be to deliver a product at a price point where there are well-qualified buyers.
- Residential building construction prices charged by contractors, measured by Statistics Canada’s Building Construction Price Index rose 3.3% between Q3 2024 and Q3 2025—covering both material and labour costs. According to respondents, non-lumber material prices to build a reference 2,400 sq ft detached home rose by $37,900 over the past year. Softwood lumber mill prices softened by roughly 9% from Q4 2024. Despite the small break in lumber, material costs remain $99,000 above the material costs at the start of 2020.
- The single-family Housing Market Index in the third quarter was 23.3, falling 1.6 points from the previous quarter and 4.1 points from a year ago. This is a new record low for the single-family HMI, surpassing the previous low of 24.6 from the fourth quarter of 2023.
- For comparison, the US’ NAHB/Wells Fargo single-family HMI was 32.3 during the third quarter.
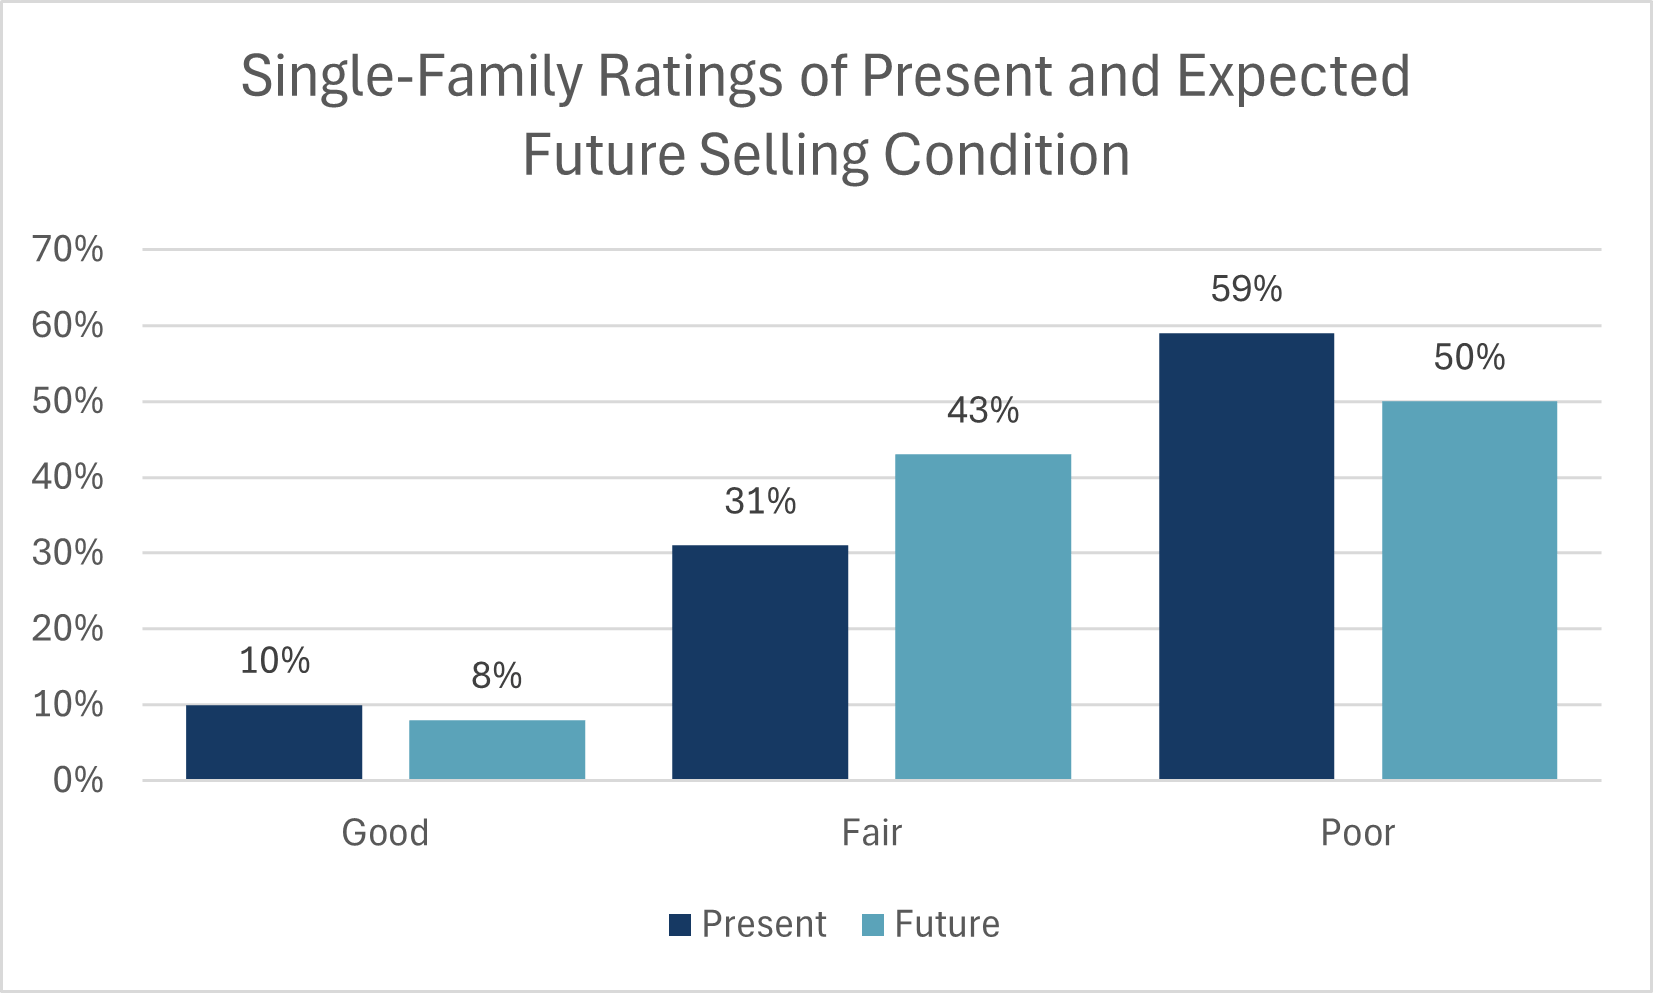
- 59% of single-family builders rated current selling conditions as Poor, equal to the proportion reported in the previous quarter.
- Just 8% of builders anticipate Good selling conditions in the next six months. Half of builders believe conditions will be Poor. 2025 surveys have shown a material decline in the optimism for a near-term turnaround for selling conditions due to the prolonged weakness of current sales conditions.
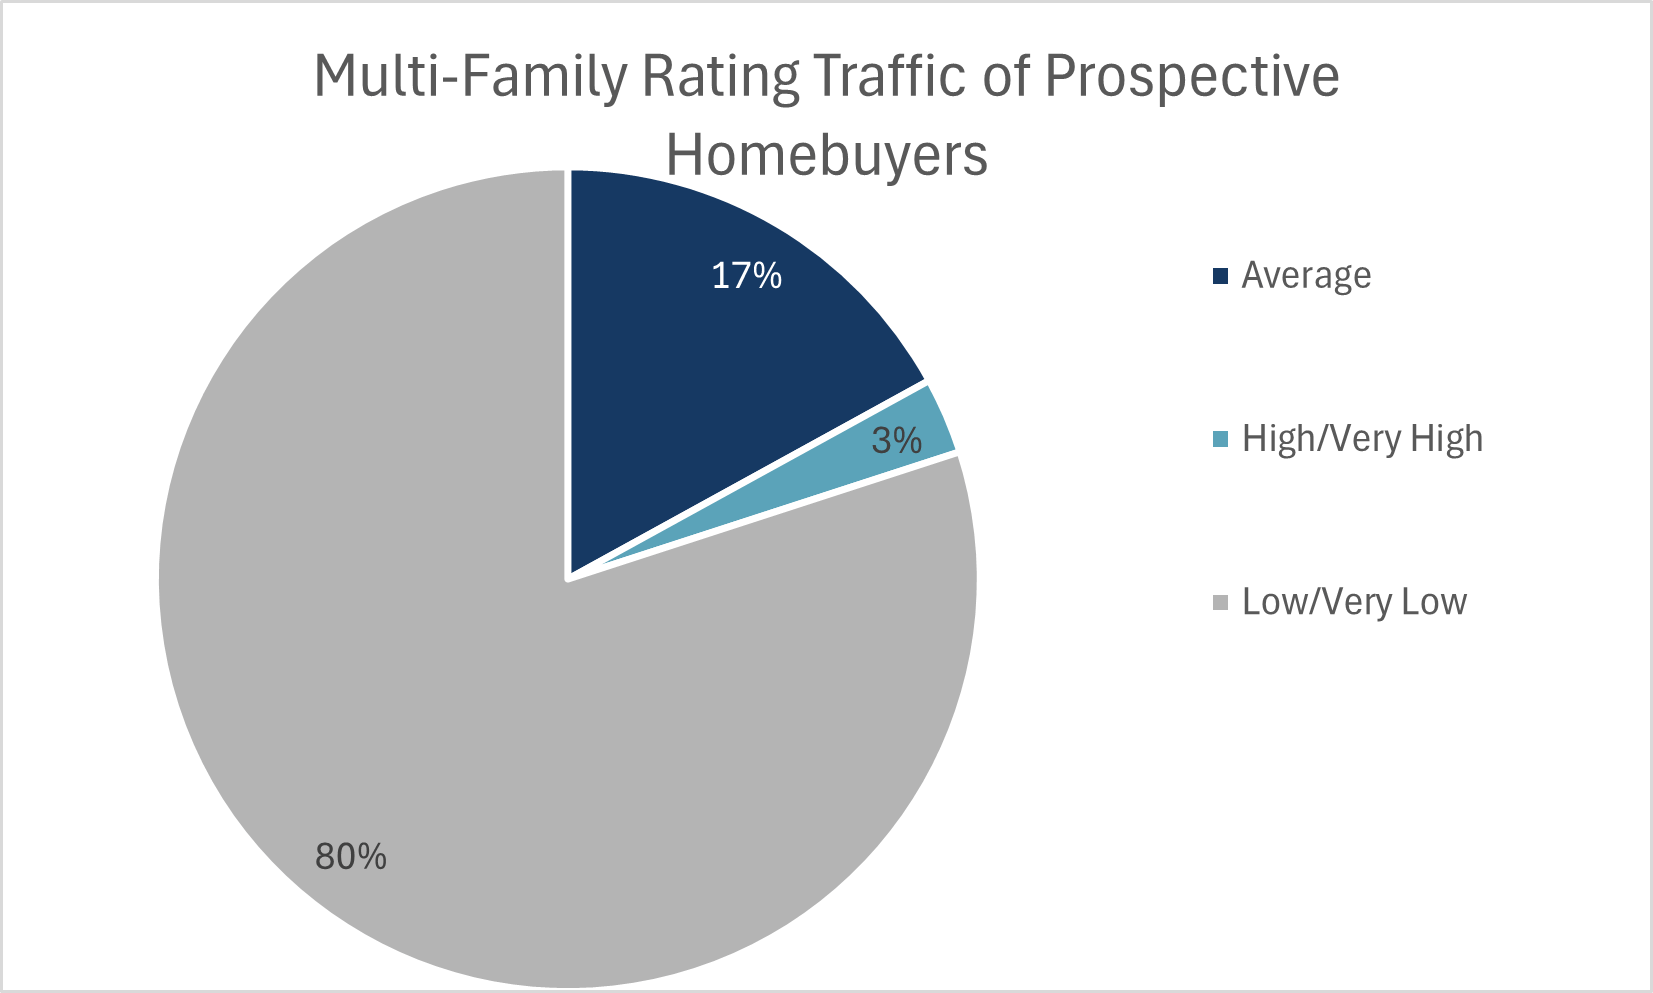
- 70% of builders rated sales office traffic and customer inquiries as Low or Very Low. Weak traffic flows have been widely and consistently reported by single-family builders since mid-2023
- Regionally, Ontario’s single-family HMI was an abysmal 7.1 and represents a 7.2-point decline from Q3 of 2024. Not far behind, British Columbia recorded a score of 11.7 and its HMI score has held in the teens since the second quarter of 2024. Alberta’s single-family HMI was 47.1, near neutral, and 1.7 points above its score from Q3 2024. While the Atlantic provinces also reported a neutral score of 47.6, it is down from scores earlier this year that were in the 60s.


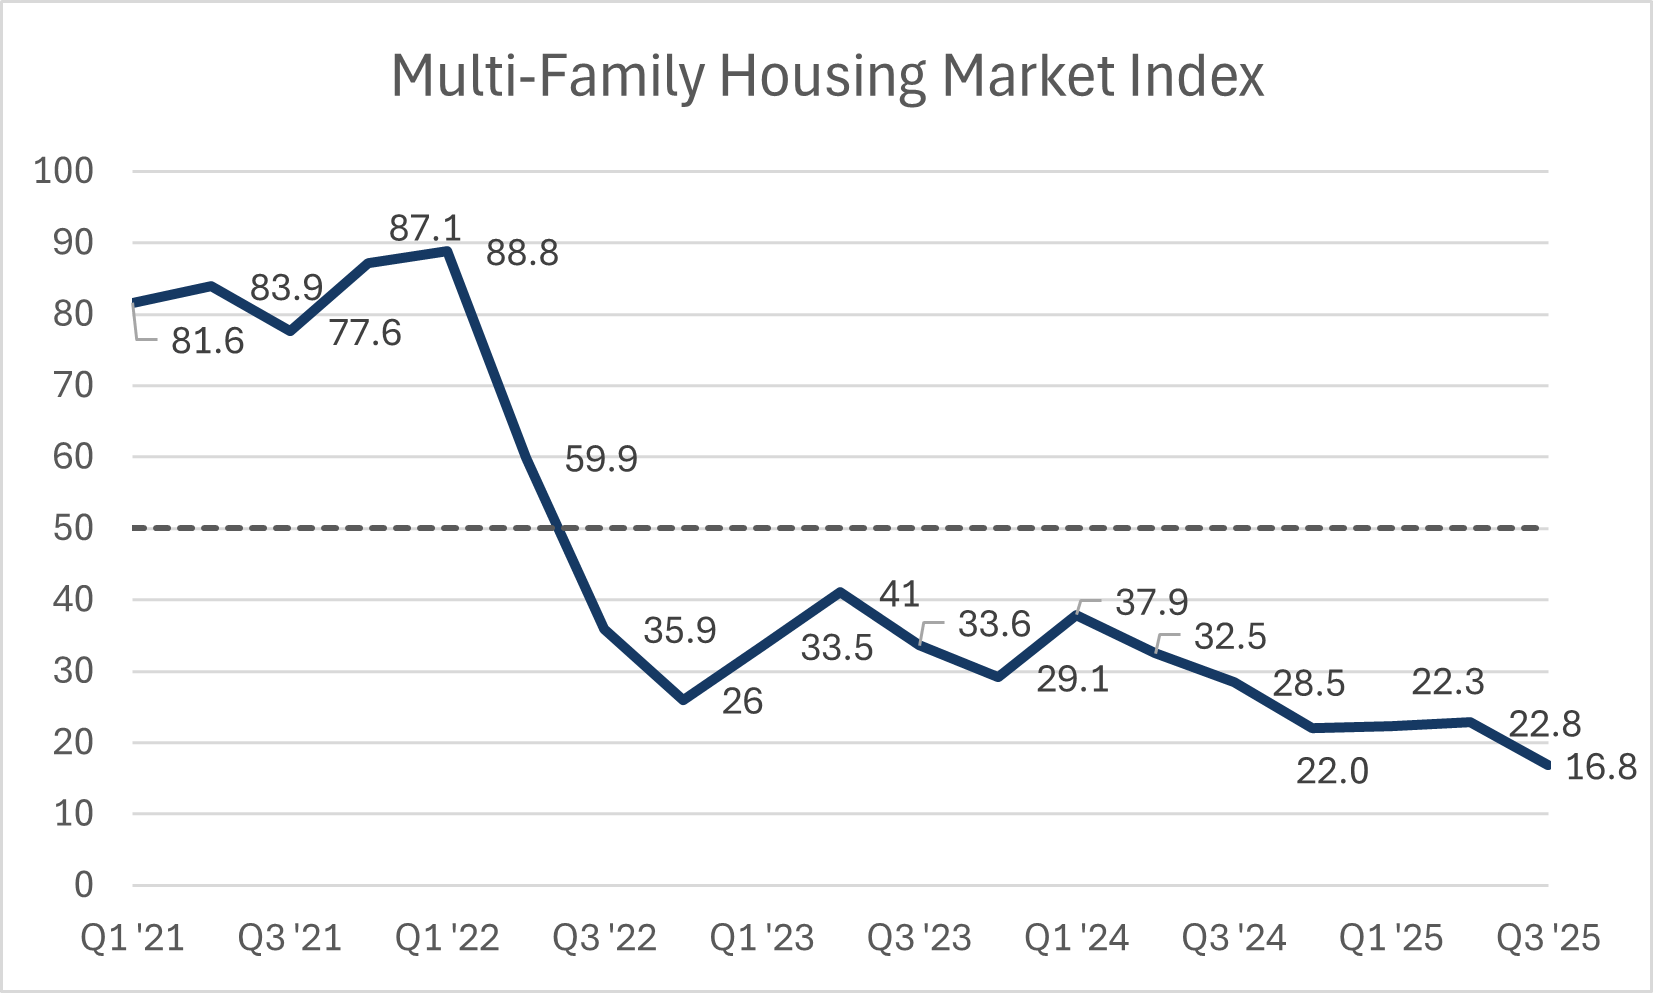
- The multi-family Housing Market Index in the third quarter was 16.8, which is an unfortunate but not unsurprising new record low. This comes after the multi-family HMI held around a score of 22 since the last quarter of 2024.
- 68% of multi-family respondents rated current selling conditions as Poor. This was the primary reason for the decline the overall multi-family HMI over the past quarter. With first time buyers more likely to purchase a multi-family unit, the delayed implementation of the GST rebate likely played a role in the further erosion of sales conditions over the summer months.
- 61% of builders also rated expected future conditions to be Poor as well. Under the prolonged weak selling conditions, builders are reducing their optimism that well qualified demand will return to the market within the next couple quarters.
- Regionally, multi-family builder confidence in Ontario remained the weakest, with a score of 4.4 and has remained in single digits for four consecutive quarters. However, the largest decline in confidence came from British Columbia, where the score of 14.7 represented a decline of 12.7 points over the previous quarter and 14.6 lower than in Q3 2024 and had a large impact on the national index. The Prairies remains around a neutral score of 52.9, however, builder sentiment has trended down since reaching a score of 73.2 in Q2 2024.

- There was a stark increase in the proportion of builders reporting permanent layoffs this quarter relative to years past. 41% of builders reported recent layoffs with no plans to rehire. This up substantially from the 27% reported in Q3 last year and even well above the 35% reported in the previous quarter.
- Payroll employment in residential construction fell by nearly 4,400 between July 2024 and 2025. While modest, this was the largest 12-month decline in residential construction employment since 2009—excluding the 2020 pandemic.
- Difficult sales conditions and the increase in permanent layoffs have also raised the overall level of concern builders have on the outlook of their business. 57% of builders are concerned or very concerned about their business over the next 12 months. This stemmed from a shrinking proportion that were just somewhat concerned.
- Builders were asked to provide any concerns they still have about the tariff situation or trade negotiations. Feedback from respondents indicates that tariff-related challenges relate to the damage they have had on home buying demand, despite the removal of much of Canada’s countermeasure tariffs. Many noted that tariffs on key metal materials like doors, window casings, sinks, and furnaces are supporting building material price pressure, as Canada’s counter tariff measures on steel and aluminium products remains in place.
- The first-time buyer GST rebate remains a drag on sales due to its lack of implementation—it has yet to be given royal asset. 39% of builders stated that they their lack of a guarantee for FTHBs that they would be eligible for this rebate hurt summertime sales. This is roughly the proportion of builders that offer entry level units or units that would be within the budgets of FTHBs.

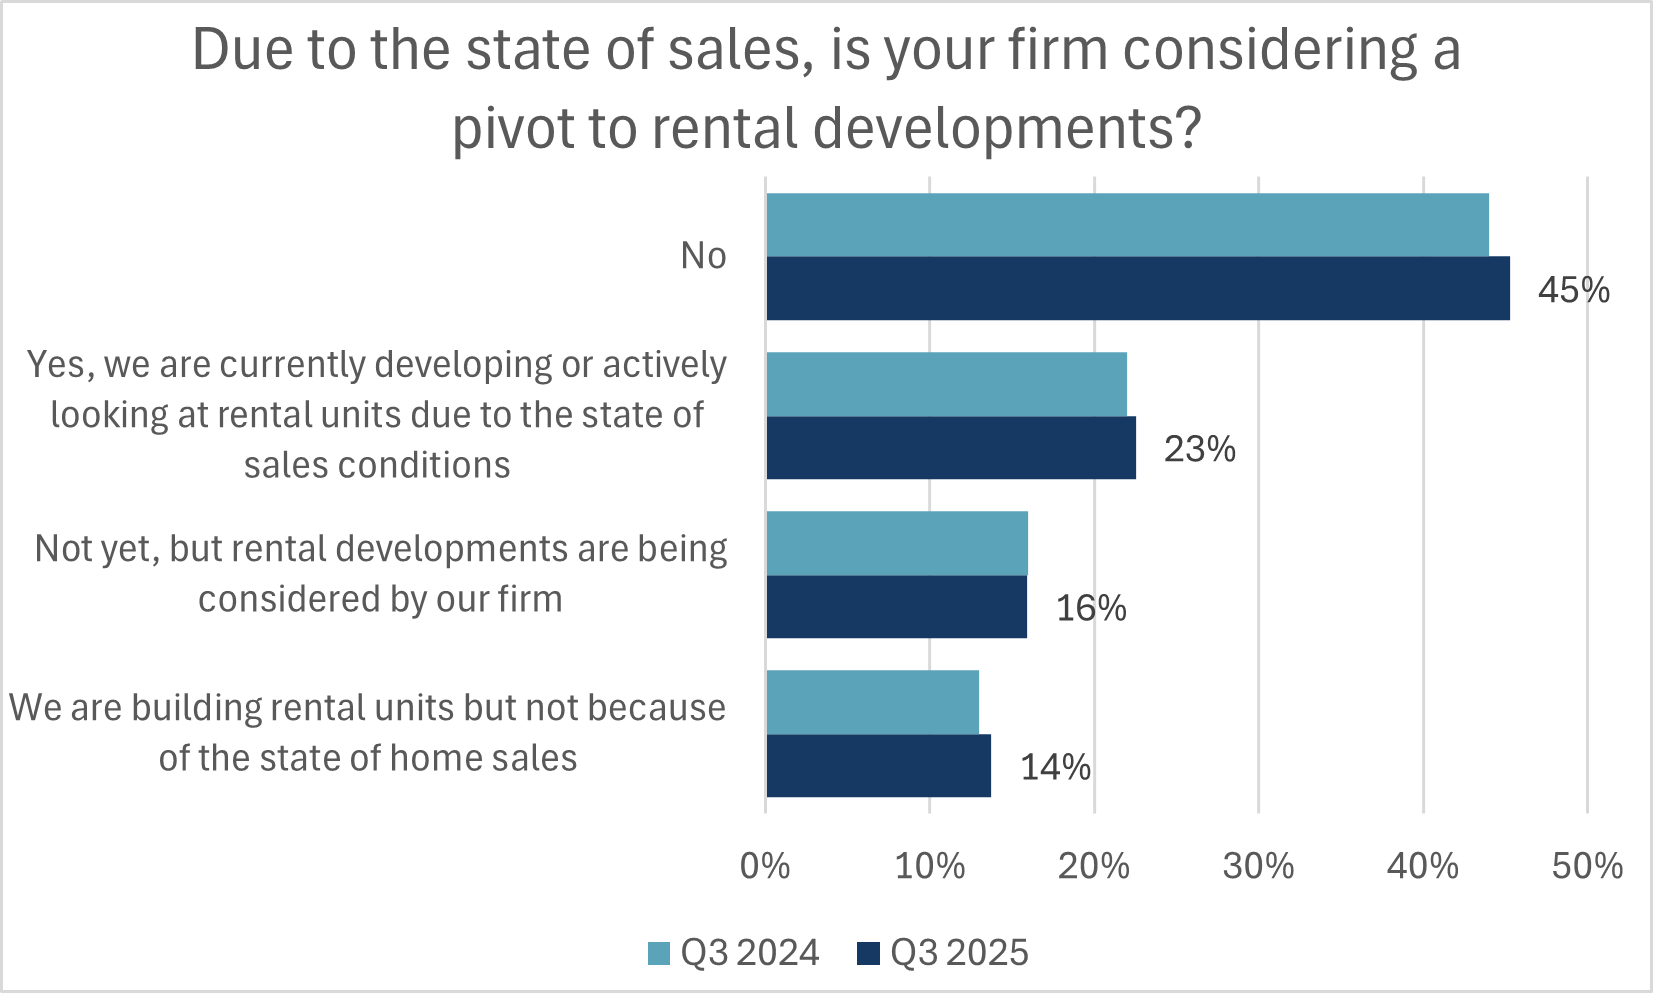
- Following up from a question posed last year, builders were asked if they are or are considering construction of rental units. The distribution across answers remains consistent with last year’s results, as 23% of respondents saying that their firm is developing or actively considering rental units. A further 16% stated that this is informally under consideration.
- Building costs continue to rise, as illustrated by the Building Construction Price Index. Based on respondent estimates, non-lumber material cost increases have added $72,000 on average to the cost of constructing a 2,400 square foot home since the start of 2020. When combined with cumulative lumber cost increases, the cost of materials alone adds $99,000 in additional costs on average on a 2,400 square foot home relative to 2020 material costs.
- The-single family builder confidence level was 24.9 in the second quarter. This is 5 points below the HMI level in the second quarter of last year and has remained at a critically low score of below 30 since the final quarter of 2023. This quarter’s score is just shy of the Q4 2023’s record low score of 24.6.
- 60% of single-family builders rated current sales conditions as Poor. This a record high proportion and led to a record low score for the present conditions sub-index. This is directly related to the consumer pullback from economic uncertainty introduced earlier this year through the trade war while the market was still recovering from high interest rates, and is compounded by first-time buyers remaining sidelined until the implementation of the enhanced GST/HST rebate.
- For a second consecutive quarter, a majority rated their expectations for future sales as Poor. Throughout 2023 and 2024, builders tended to remain optimistic and expected selling conditions to recover to an average pace of sales. This is a marked change in the first half of 2025, and does not bode well for starts moving forward.
- As a relative comparison to the United States, the NAHB HMI for single-family builder confidence averaged 35.0 in the second quarter—falling 8 points from the previous quarter, but still 10 points higher than Canada.
- The regional results continue to show that sales conditions continue to languish in Ontario and British Columbia relative to other parts of the country. The index for Ontario was 10.2 and 12.1 in British Columbia; these scores were down 1.4 points and down 5.7 points from the second quarter of last year. The index for the Prairie provinces was 45.1. While close to a neutral score, the Prairies have failed to return above a score of 50 since Q2 of last year. Atlantic provinces recorded a strong score of 60.8, the highest across the country.
- The multi-family HMI was 22.8 for the second quarter. This overtly low score has remained nearly unchanged, at a record low, for three consecutive quarters. This is due to no material improvement in sales conditions, especially in Ontario.
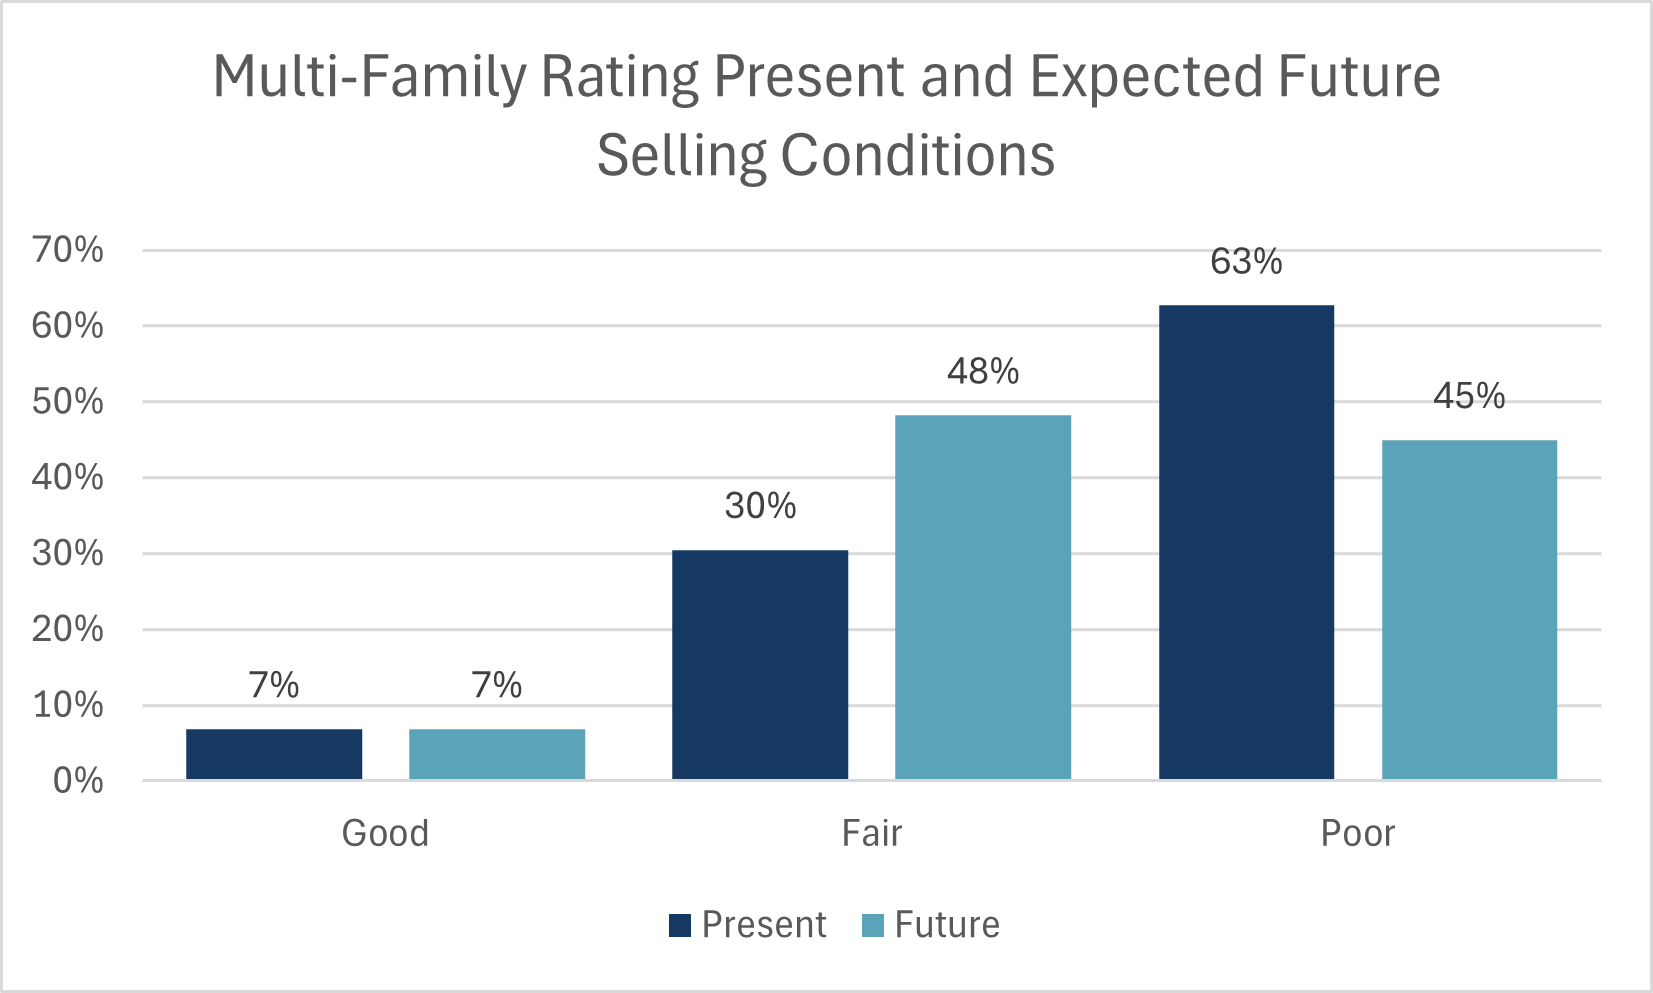
- As with last quarter, a record high 63% of builders speaking to multi-family developments rated current selling conditions as Poor. Just like the single-family HMI’s present selling conditions, this can be tied to economic uncertainty and the delayed introduction of the GST rebate for first time buyers.
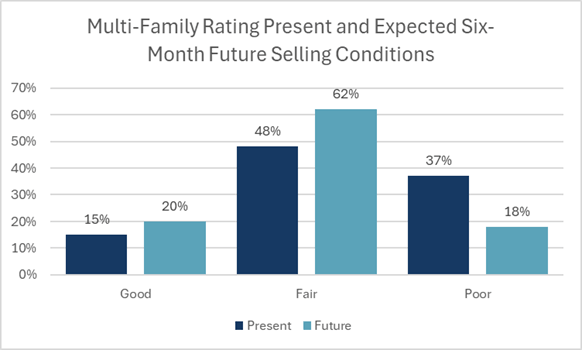
- However, unlike the single-family HMI, there was some improvement in builder views on sales expectations in the next six months. 48% of builders expect conditions to be Fair, which is 12 percentage points higher than the previous quarter and 7 percentage points higher than a year ago. This is partly related to the outlook on the improved GST/HST rebate for first-time buyers—more applicable to condo and plex type dwellings.
- While the sales office traffic and inquiries sub-index improved from the previous quarter, there are no areas in the country where builders are rating this as High or Very High. The overall sub index remained weak during the important spring selling season.
- Regional trends generally held from previous quarters. Builder confidence in Ontario was 7.4, continuing to highlight the dire market conditions—particularly in the Toronto CMA. Confidence in British Columbia was 27.4, which has led to HMI scores under 30 for a full year. With a score of 47.3, sales conditions in the Prairie provinces are on a concerning downtrend since reaching a strong score of 73.2 in Q2 of last year.
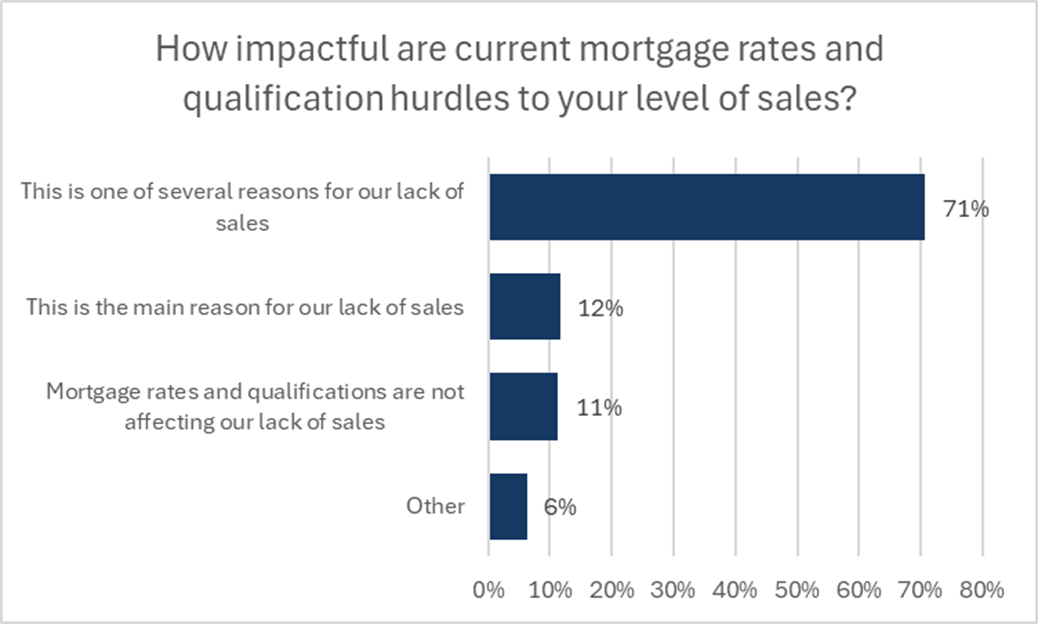
- Builders were asked about the impact prevailing mortgage rates and the minimum qualifying rate stress test are having on their level of sales. 83% of respondents stated these factors are affecting sales. 12% stated this was the main reason for lack of sales, while 71% stated they are among many reasons sales are slow, indicating the need for policy change in these and many other areas to reverse the tide.
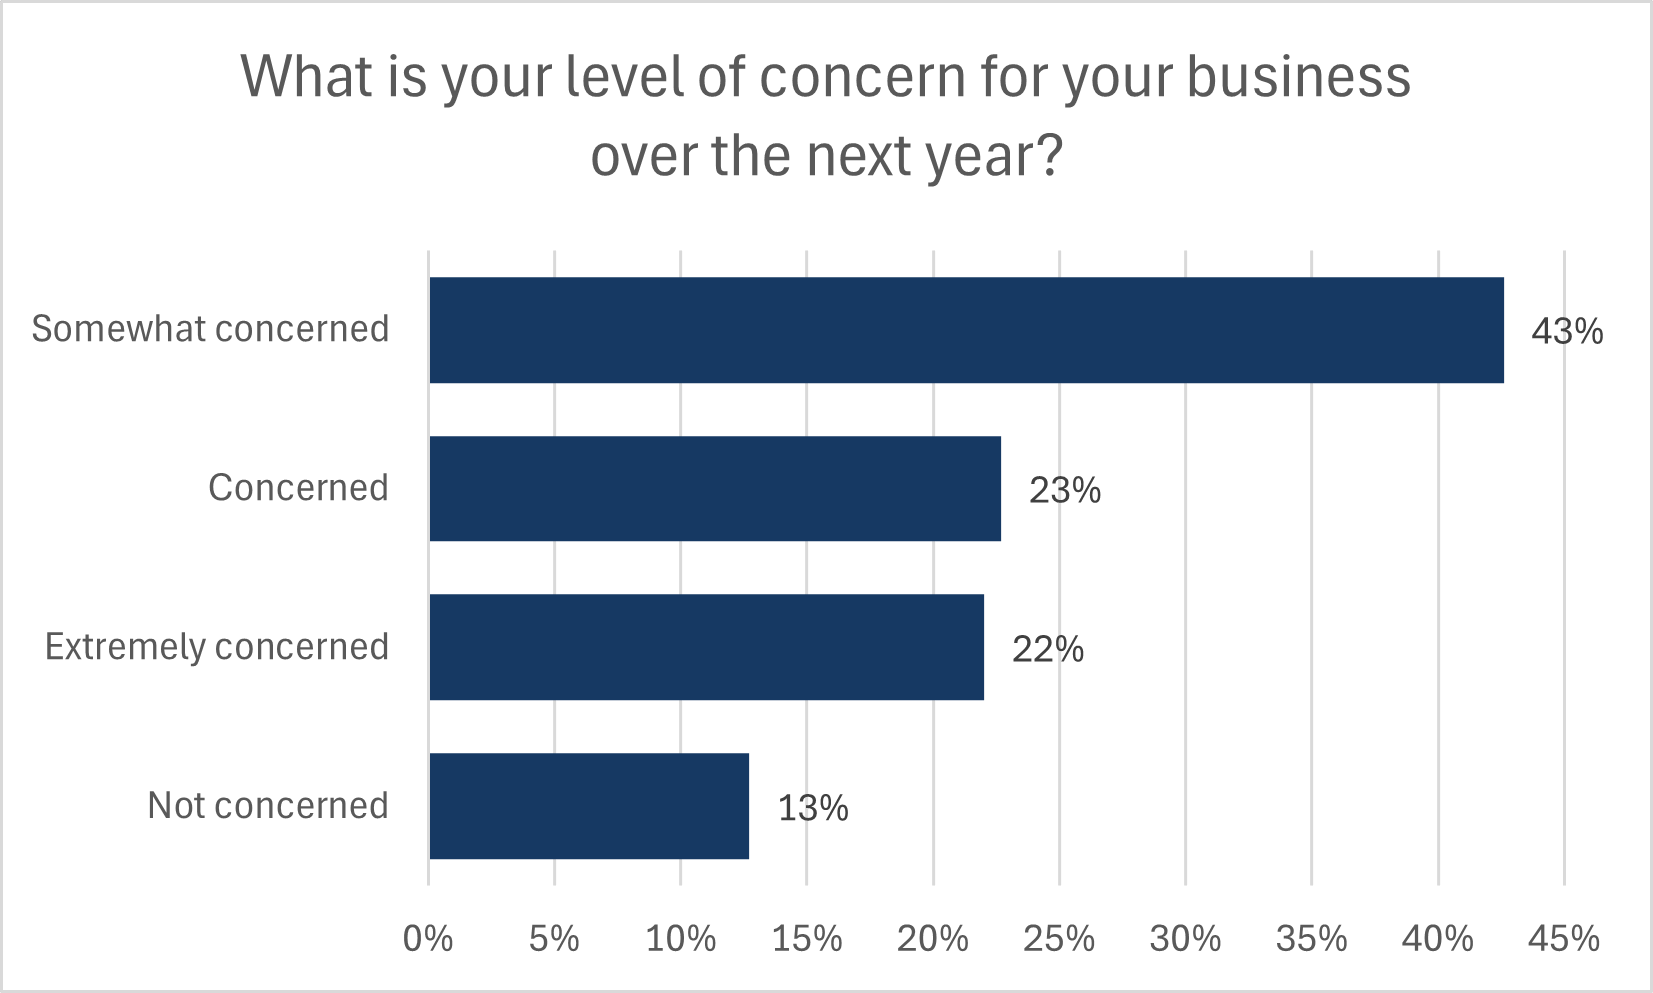
- 87% of builders stated that they have a level of concern about the well-being of their business over the next 12 months, with over 1 in 5 saying they are extremely concerned
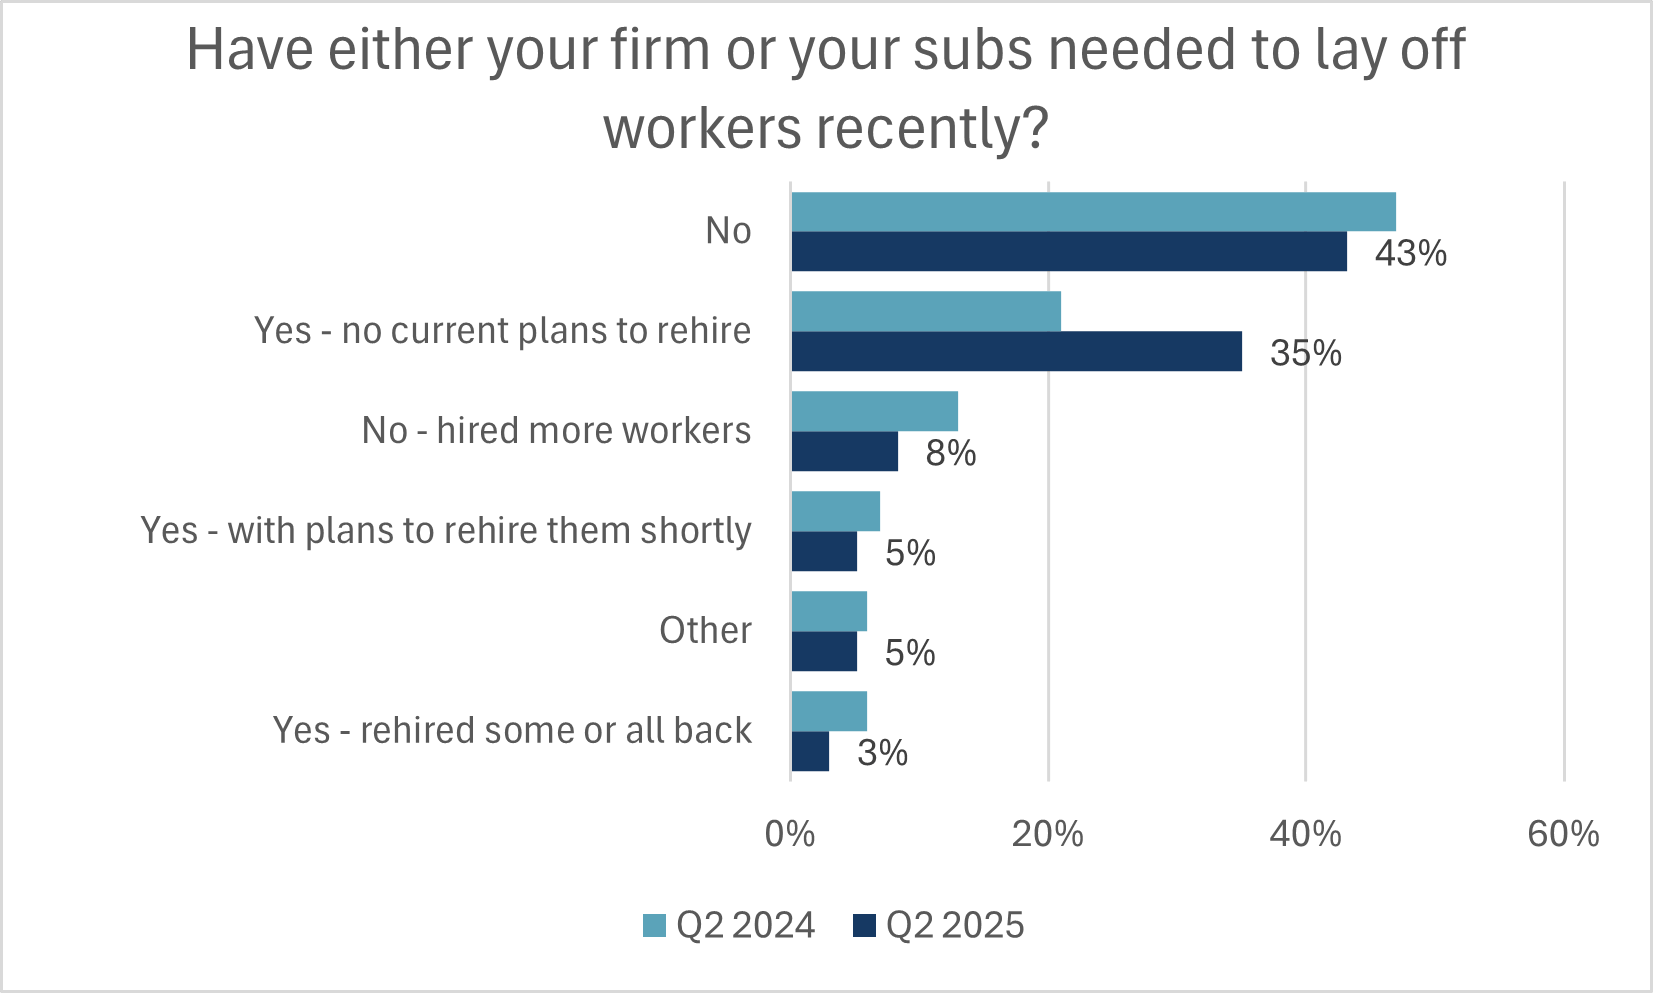
- Builders were again asked about worker layoffs within their firm and the subs they use. 35% said that they have and have no current plans to rehire. Of concern, this response rate is up sharply from the 21% of builders that stated this in the second quarter last year. While builders and contractors have reported holding onto their workers in hope of a market turn around, this may no longer be feasible.
- 56% of builders felt that expanding the HST/GST rebate from first-time buyers to all buyers on homes under $1 million, declining up to $1.5 million, is critical for the policy to unlock additional sales and housing starts. A third of builders felt that the GST waiver will provide modest help in its current form but still felt that eligibility for all buyers is needed to help turn the market around.
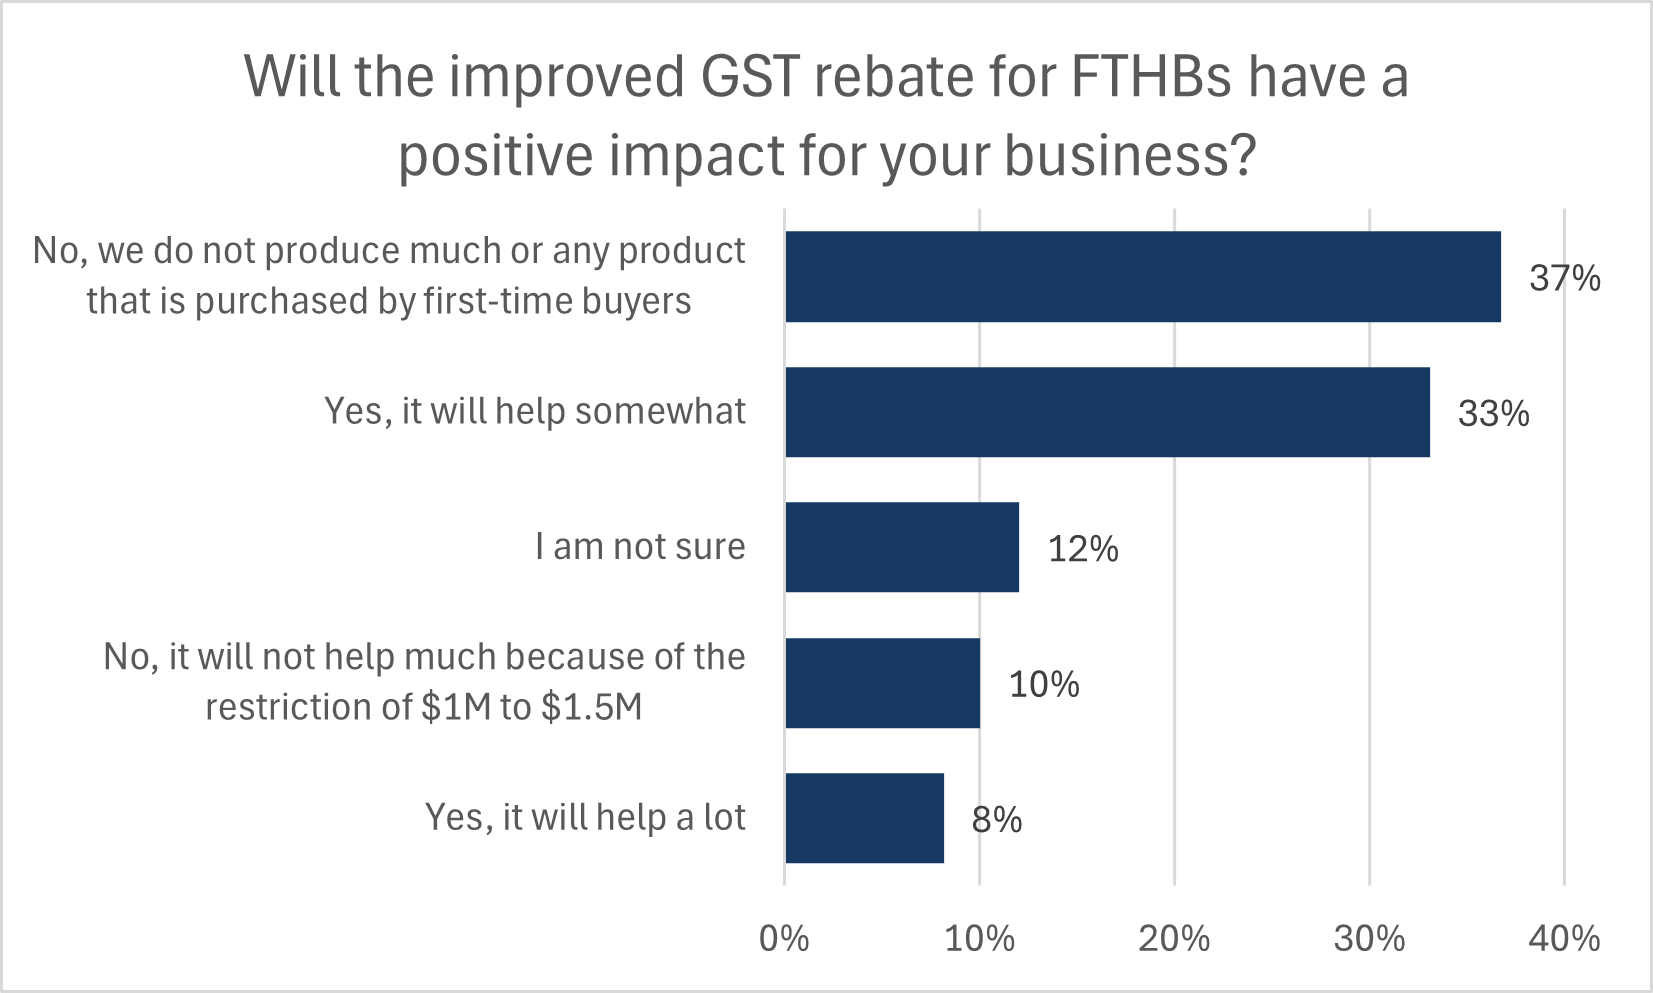
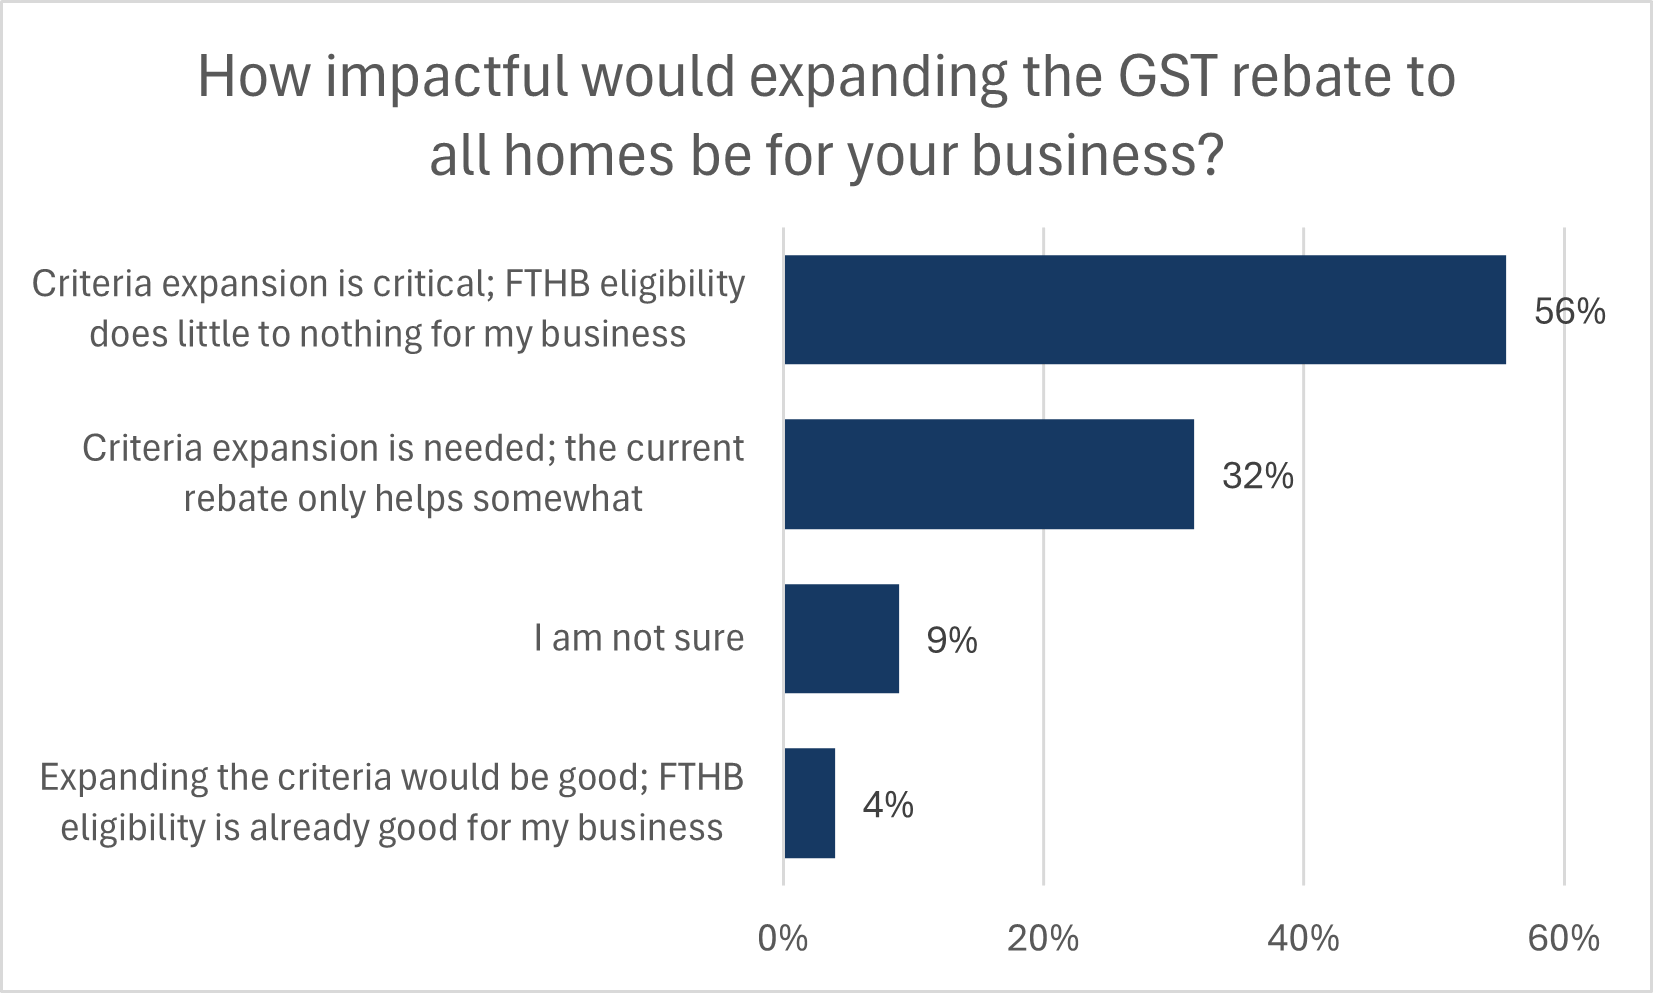
- Over the past year, several policy changes have been introduced to support additional new home sales. To gauge the polices’ collective effect of helping sales conditions rebound, builders were asked if their expectations for sales if there was no trade war with the US. While 36% felt that their sales would indeed improve, 45% still felt like these policies are not enough to turn the market around from its current state.
- 62% of builders stated that it has become significantly more difficult to price their homes with the high level of tariff uncertainty relative to 28% that said it has not. This difficulty stems from both the tariffs in place that have had varying degrees of effect on retail prices of building materials and the tariffs that could be enacted in the near future.
- Builders were asked to estimate the percentage increase they have seen so far to building materials. The majority reported cost increases under 10%. However, there is a wide distribution of estimates, reenforcing the fact that supply chains are very different from region to region, with varying degrees of construction material integration with the US.
- Builders were asked to comment on the impact of tariffs that have been implemented by Canada so far. Cost concerns were concentrated with glass products, steel products, and HVAC equipment. Due to the regional nature of both supply chains and home sales conditions, many builders noted they have not yet noticed a tariff impact on their construction materials.
- Providing some assurance, the majority of builders noted they have not felt a price impact on foreign building materials that are first imported into the US before being distributed to Canadian material suppliers.
- Approximately one third of the respondents stated that they utilize one or more kind of factory-built construction technique. This is very similar to the utilization seen in the previous two years this question was asked. Use of panelized components continues to be the most prevalent—at 26% of all builders surveyed. While the panel of builders surveyed was not calibrated to ensure specific coverage of factory construction builders, 7% stated they utilize modular construction and 5% utilize pre-engineered packages. Out of the subset of builders that do take advantage of factory-built construction, 72% have partnered with suppliers, rather than done in-house.
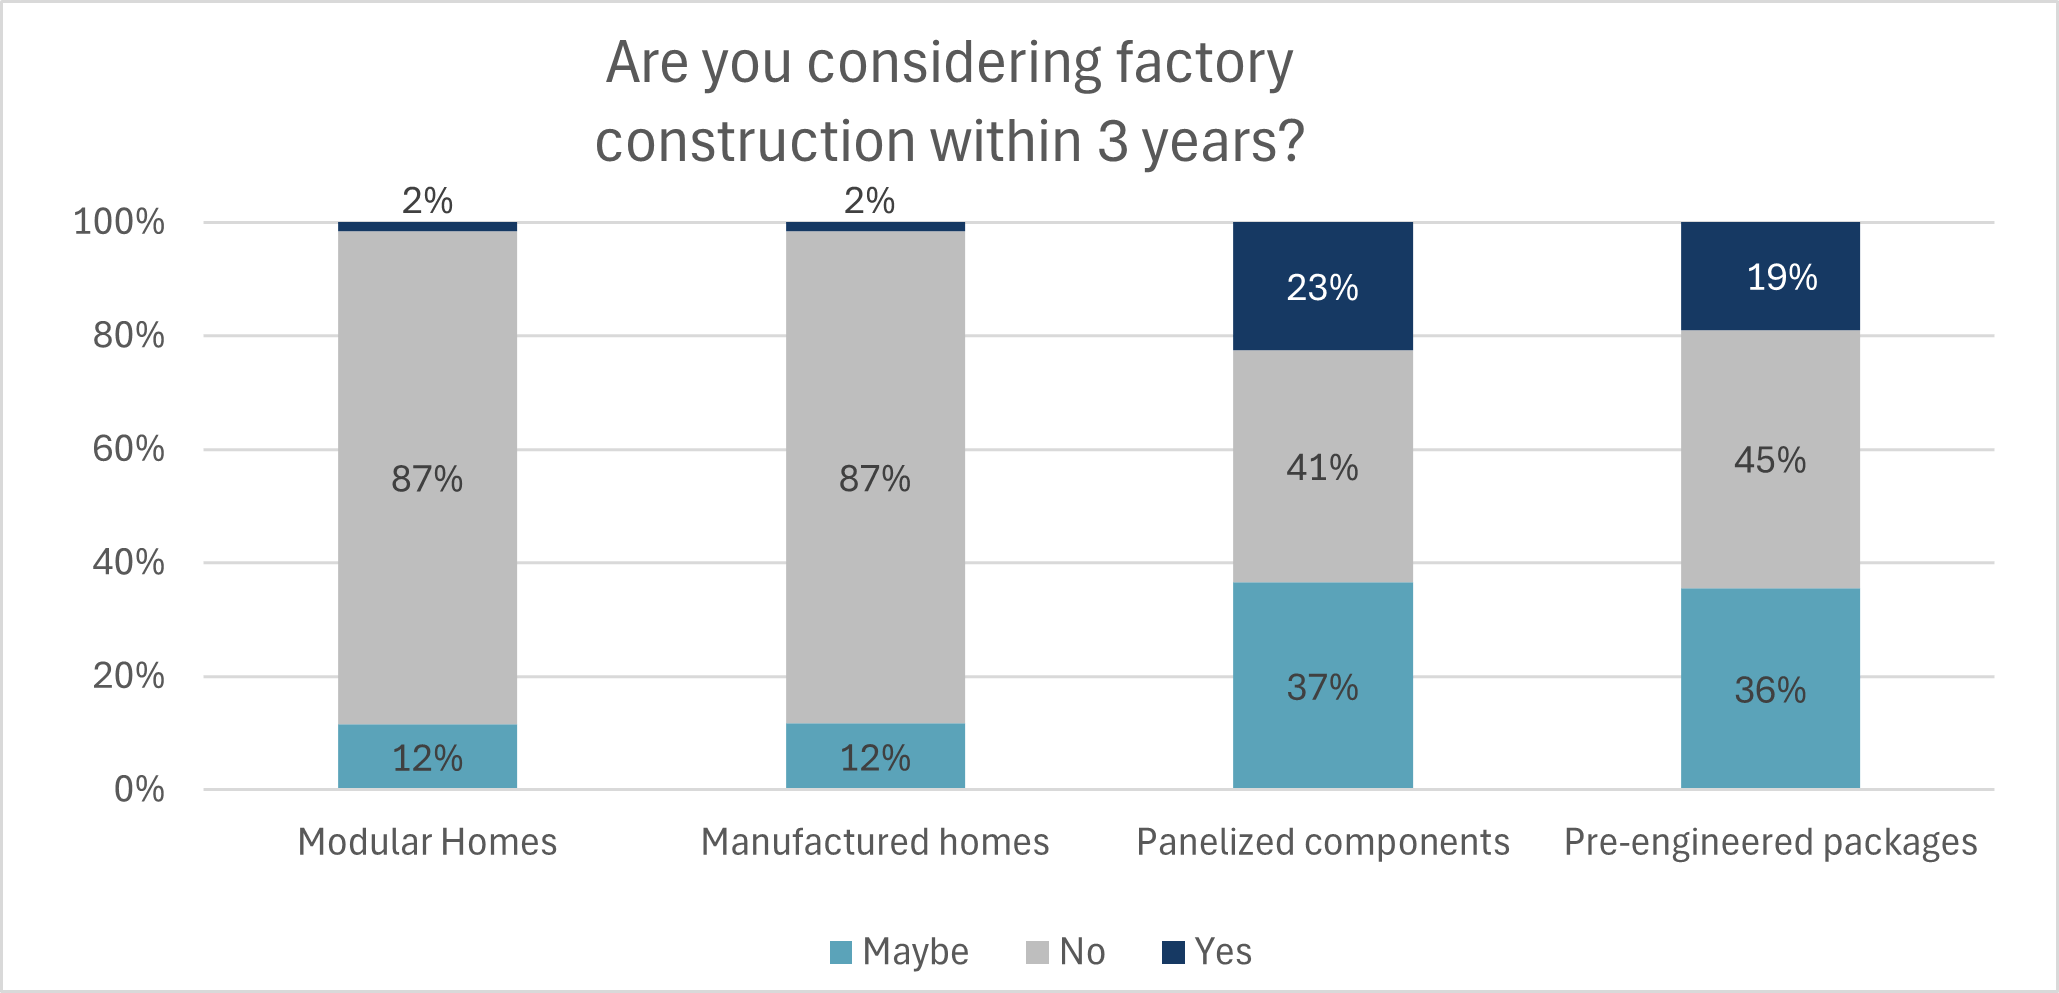
- Among the subset of builders that do not currently utilize factory construction, there is also a stark difference between the kinds of techniques they would consider over the next 3 years. 59% of these builders are giving some level of consideration to using panelized components, 55% are considering pre-engineered packages and 13% to either modular or manufactured homes. This group would also strongly tend towards partnering with an existing factory over in house operations.
- While the impact of tariffs has more so affected economic certainty, the cost of construction continues to climb. Builders were asked to update their estimate of increases to the cost of non-lumber construction materials over the past year. Based on these estimates, non-lumber materials cost $69,650 more to build a 2,400 square foot home than it did at the beginning of 2020—prior to an era of the rapid cost growth. In combination with rising lumber costs, the material cost increase on a 2,400 square foot home since 2020 has risen by over $96,000.
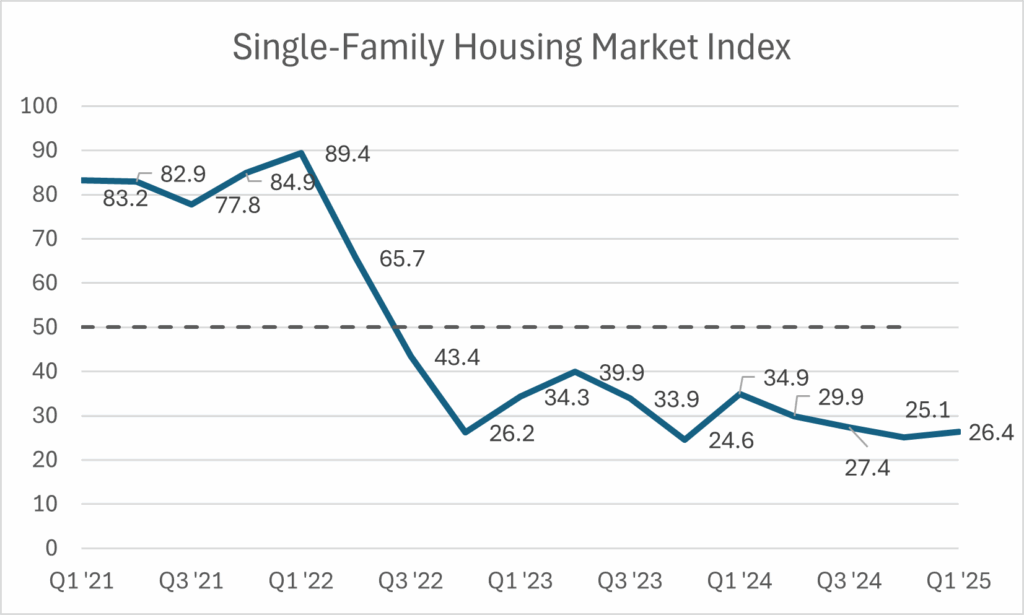
- Single-family builder confidence was 26.4 in the first three months of 2025. This is a small increase of 1.3 points over Q4 2024, but a decline of 8.5 points from the same quarter in 2024 and represents sentiment still within touching distance of the index’s all time low of 24.6 points recorded in Q4 2023—before the Bank of Canada started to lower rates.
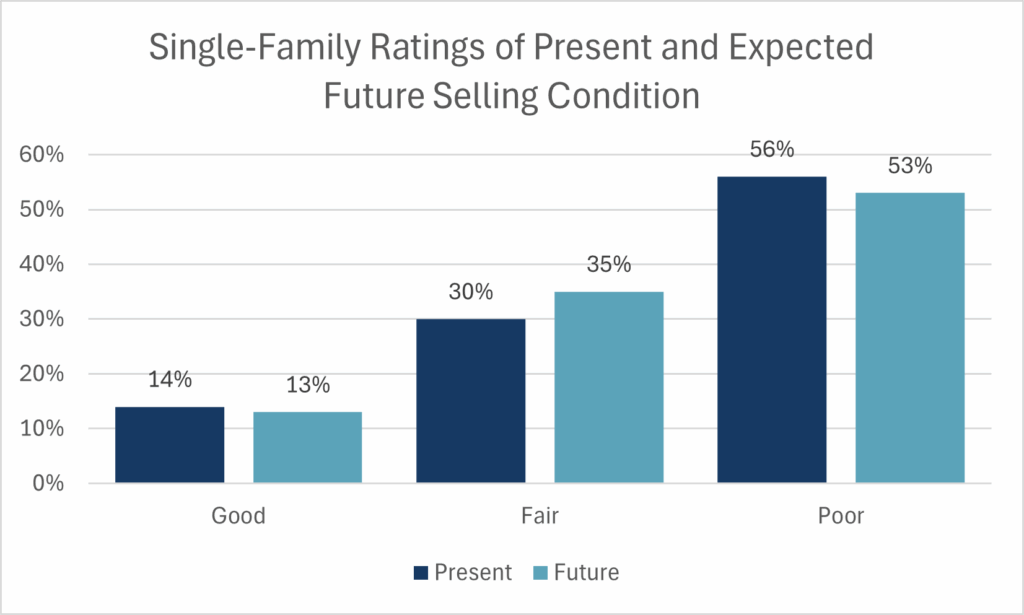
- 56% of builders rated present selling conditions as Poor. The majority of single-family builders have given a rating of Poor in five of the past six quarters.
- Likely related to the tariff situation, 53% expected future sales to be Poor. Since the start of 2023, builders have been hopeful that sales would improve to more normal conditions, however, this is no longer the case.
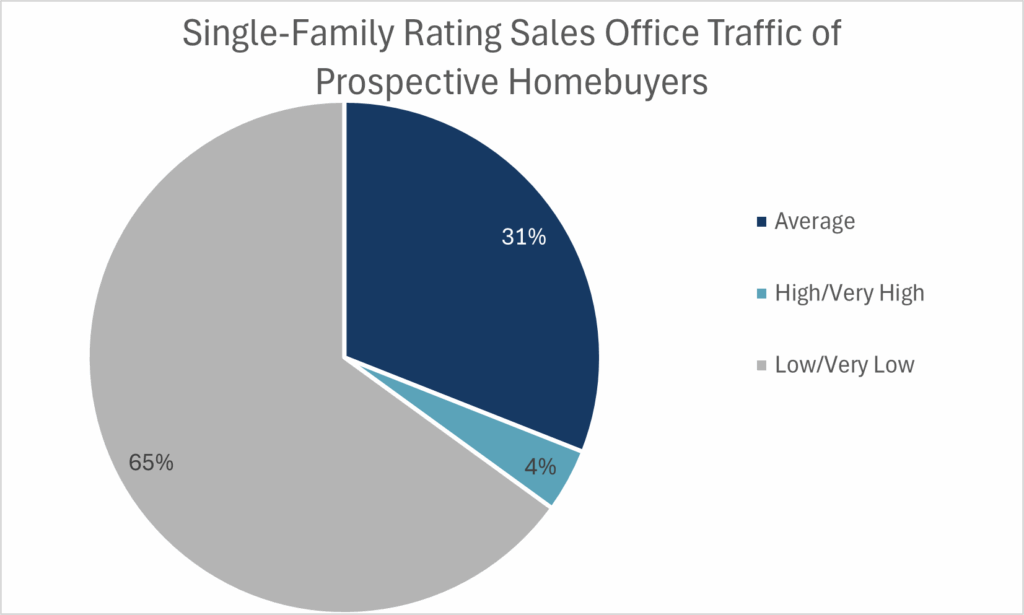
- Sales office traffic or general sales inquiries showed no signs of improvement, and 65% of builders rated conditions as Low or Very Low. The proportion of builders that rated traffic as High or Very High has remained in single digits since the third quarter of 2023.
- Regional trends showing Ontario and British Columbia faring much worse than builders in Prairies and Atlantic provinces continued this quarter. Builder confidence in Ontario fell to a record low of 7.4—recording single digits for the first time. Sentiment in British Columbia increased somewhat over last quarter but was still an abysmal 17.2. Sentiment in the Prairie Provinces was 49.0, remaining close to a neutral score for the past three quarters. Atlantic Canada was the sole bright spot for single family construction, rising 21.4 points over the previous quarter to 66.3—suggesting a strong start to the spring selling season.
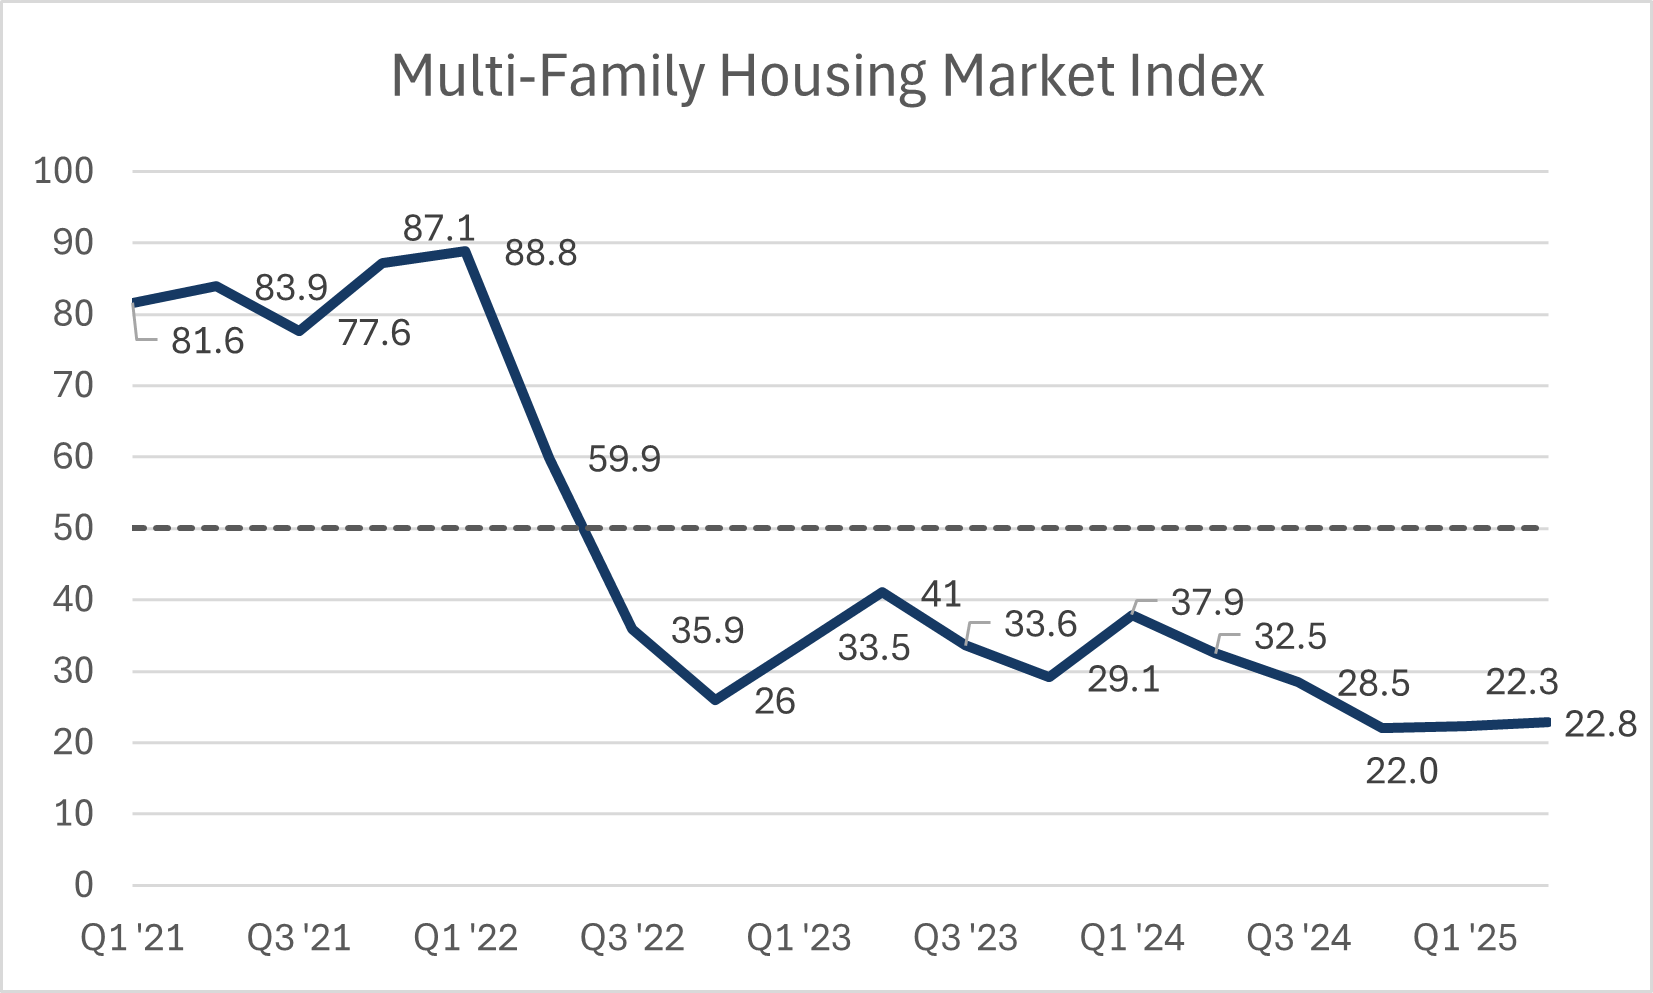
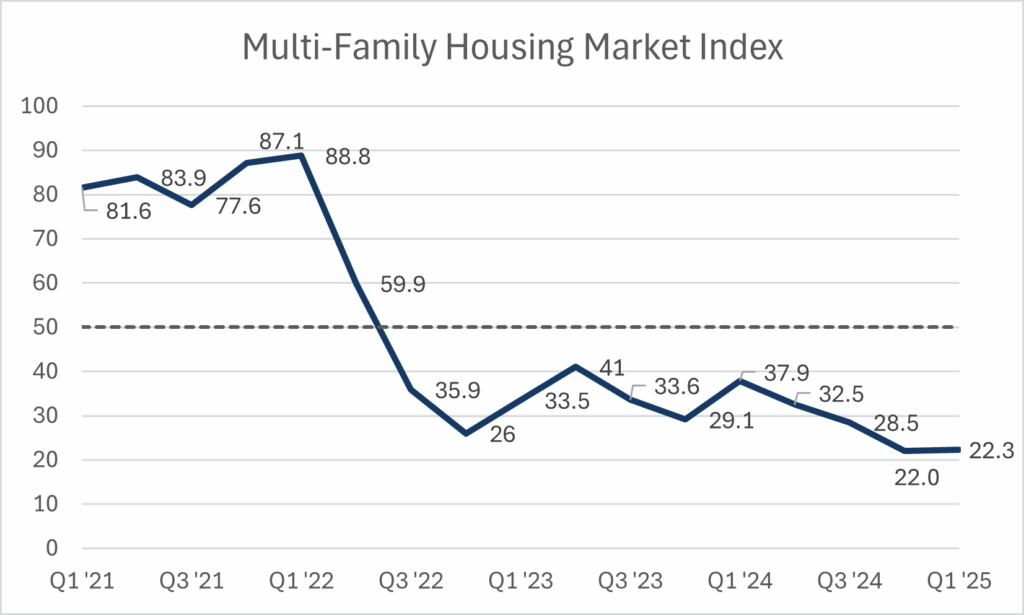
- The multi-family Housing Market Index was 22.3 in the first quarter of 2025, essentially unchanged from the record low of 22.0 recorded in the previous quarter. However, it is 15.6 points below the score recorded a year ago, suggesting that this year there is no seasonal boost from the start of the spring selling season.
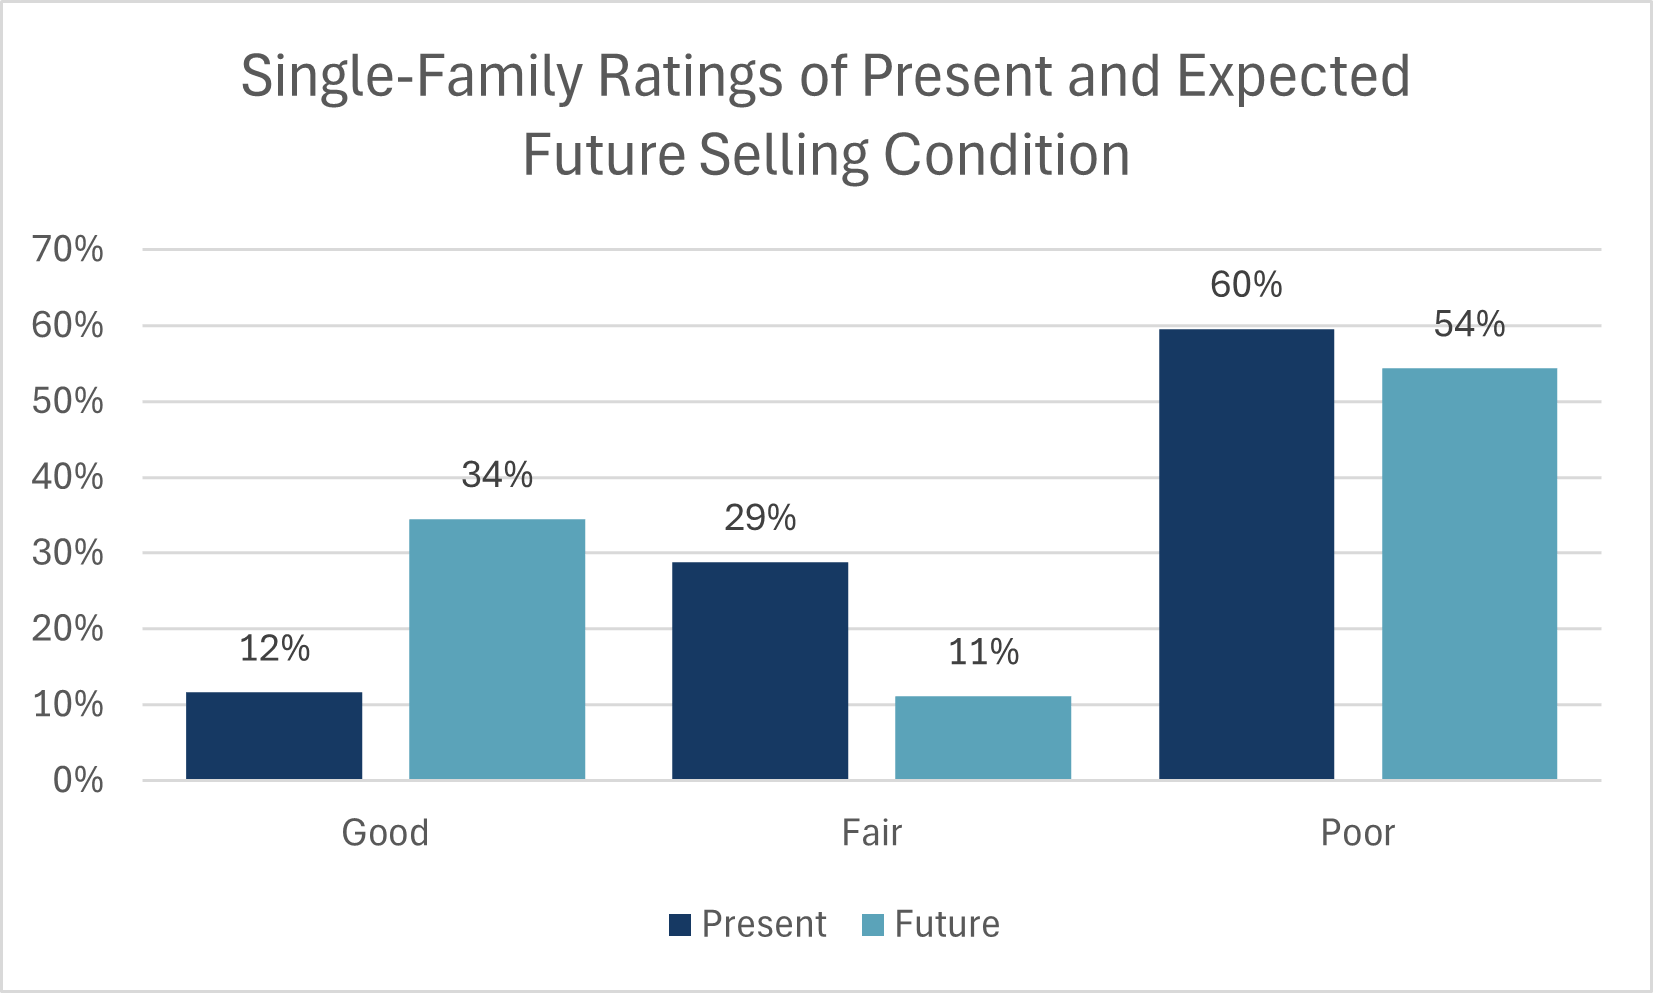
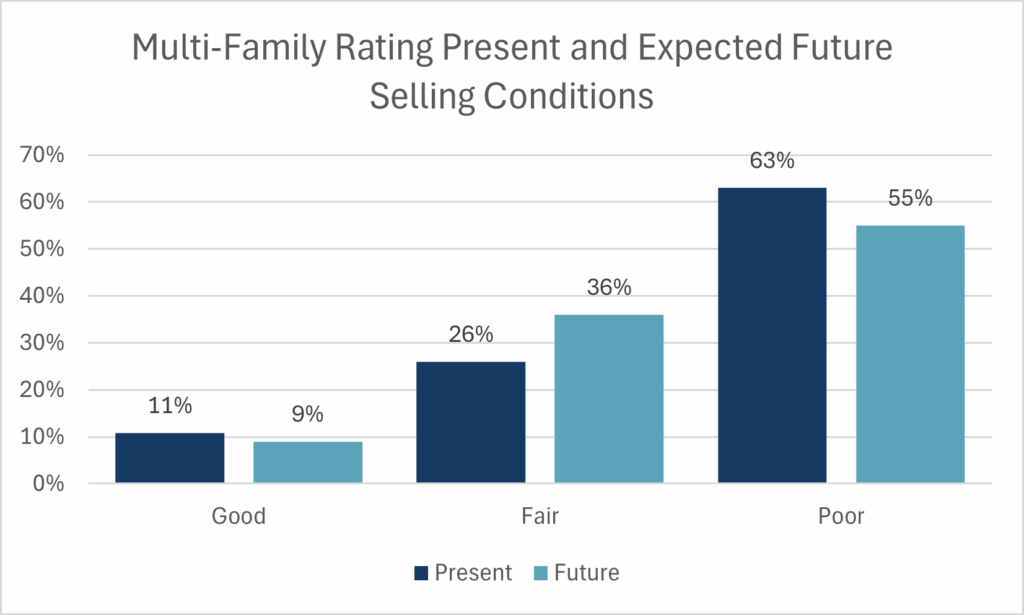
- Particularly concerning was the 63% of builders who rated current selling conditions as Poor. This was a record high in terms of the breadth of negative opinions. Only 11% rated sales as Good.
- Like the single-family HMI, in the past, multi-family builders have tended to expect improvement to average selling conditions in the near future. Bucking that trend, a record high 55% of builders rated their expectation for future selling conditions as Poor. Prolonged weakness in the market and the threat of tariffs have reduced this optimism.
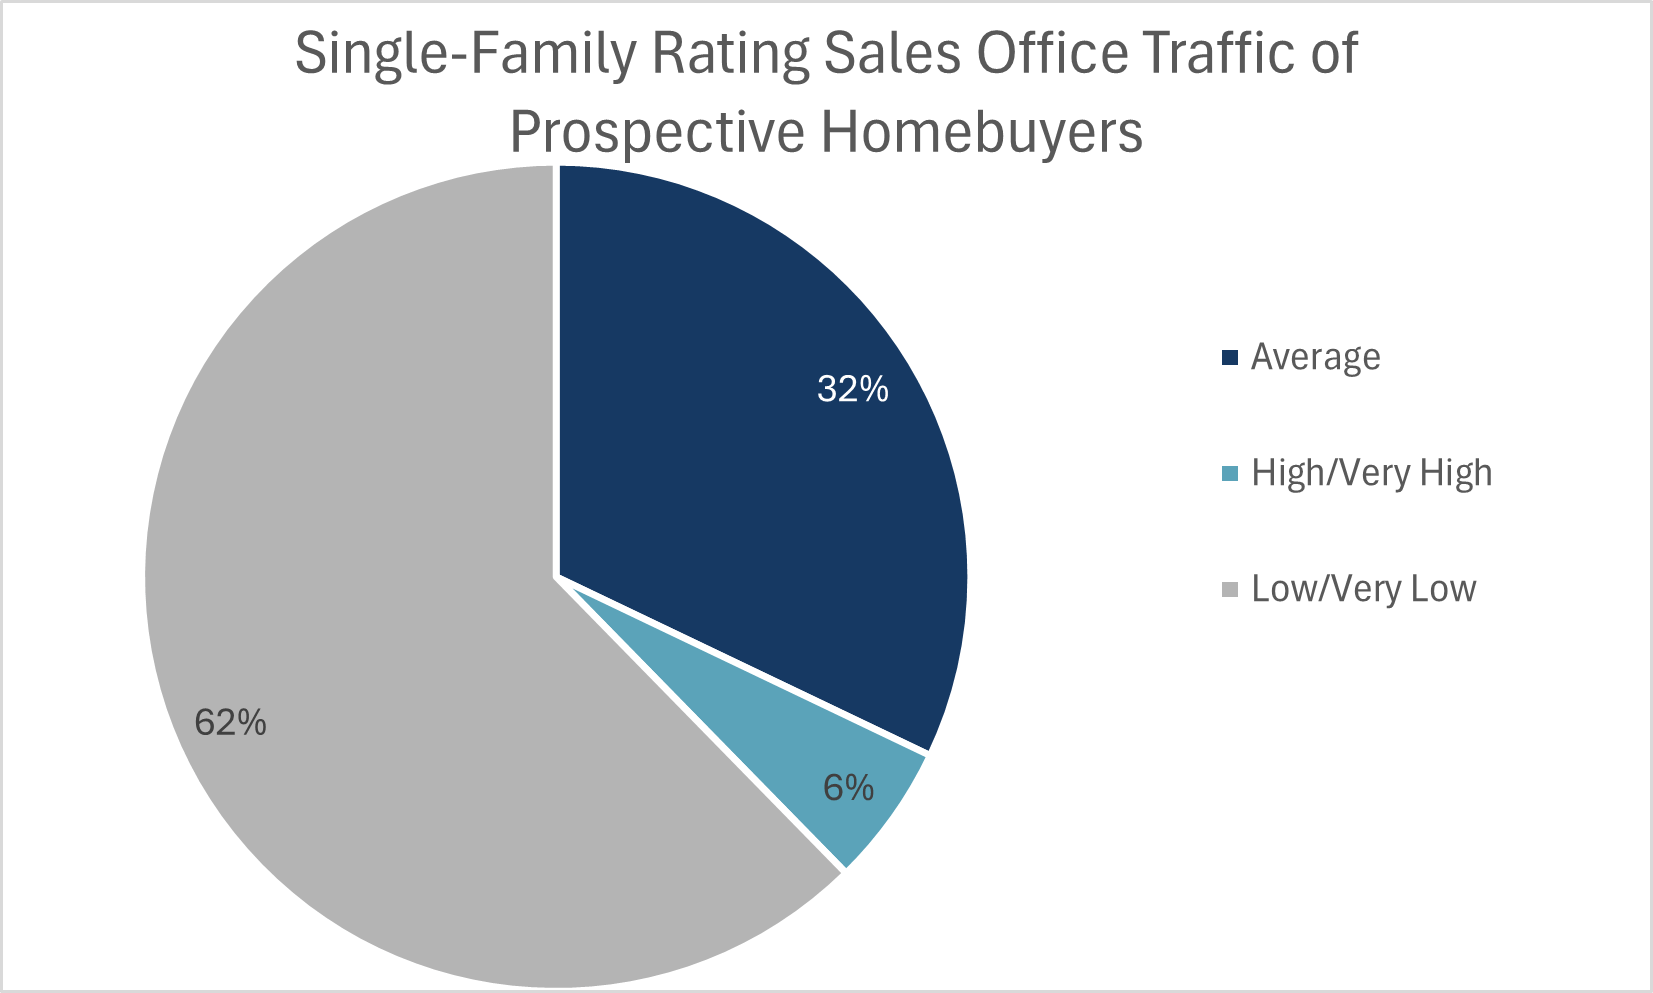
- Sales office traffic remained weak, as 65% of builders rated conditions as Low or Very Low. Surprisingly, this improved over the 81% that gave this rating the previous quarter, which could be related to seasonal factors. This improvement helped the overall multi-family HMI avoid setting another record low in builder confidence.
- Regional trends re-enforce how dire markets conditions are in Ontario, with an HMI of 2.9, falling from a score of 6.2 in the previous quarter. British Columbia remained pessimistic with a score of 24.8, down 18 points from a year ago. The Prairie Provinces maintained their position as the sole bright spot, with a score of 61.3, rising 6.8 points from a year ago.
.png)
.png)
.png)
Each quarter, CHBA asks a set of topical questions to understand the HMI results better as well as other industry issues. This quarter, the questions were largely focused on the threat of tariffs. While Canada’s phase II list of counter tariffed products was not implemented on April 2nd, it has not been officially removed as policy consideration, pending what the U.S. does moving forward.
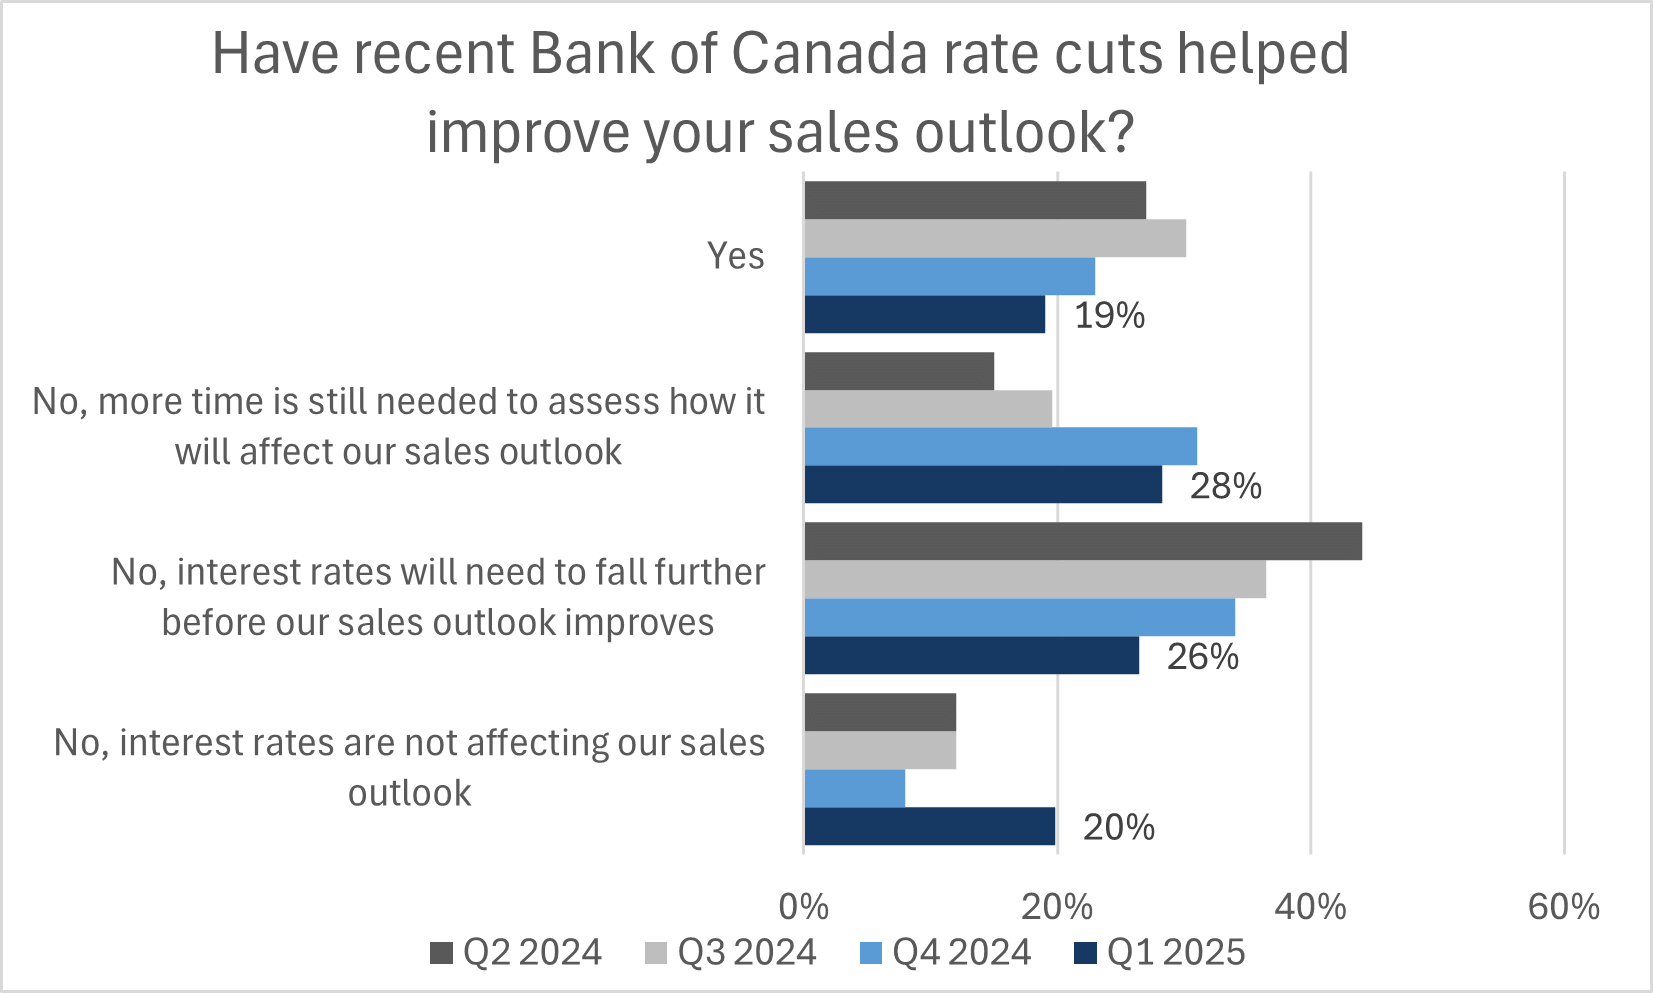
- Builders were asked if the Bank of Canada’s 25 basis point cuts in January and March helped improve their expectations for sales over the next six months. Just 19% stated that it did, notably lower than the three previous quarters. The biggest change from past quarter was in the 20% of builders saying that interest rates are not affecting their sales outlook, up from 8% last quarter and 12% in Q2 2024. This is reflective of the trade war, but also mortgage rates not lowering in tandem with the Bank of Canada rate.
- Builders were asked if they had already received a notification from a supplier about a cost increase in 2025—regardless of the reason. 71% of builders said they had, while 24% said they have not. The threat of tariffs threatens to increase the prices of a broad range of goods and likely includes items that are not listed under Canada’s counter tariffs.
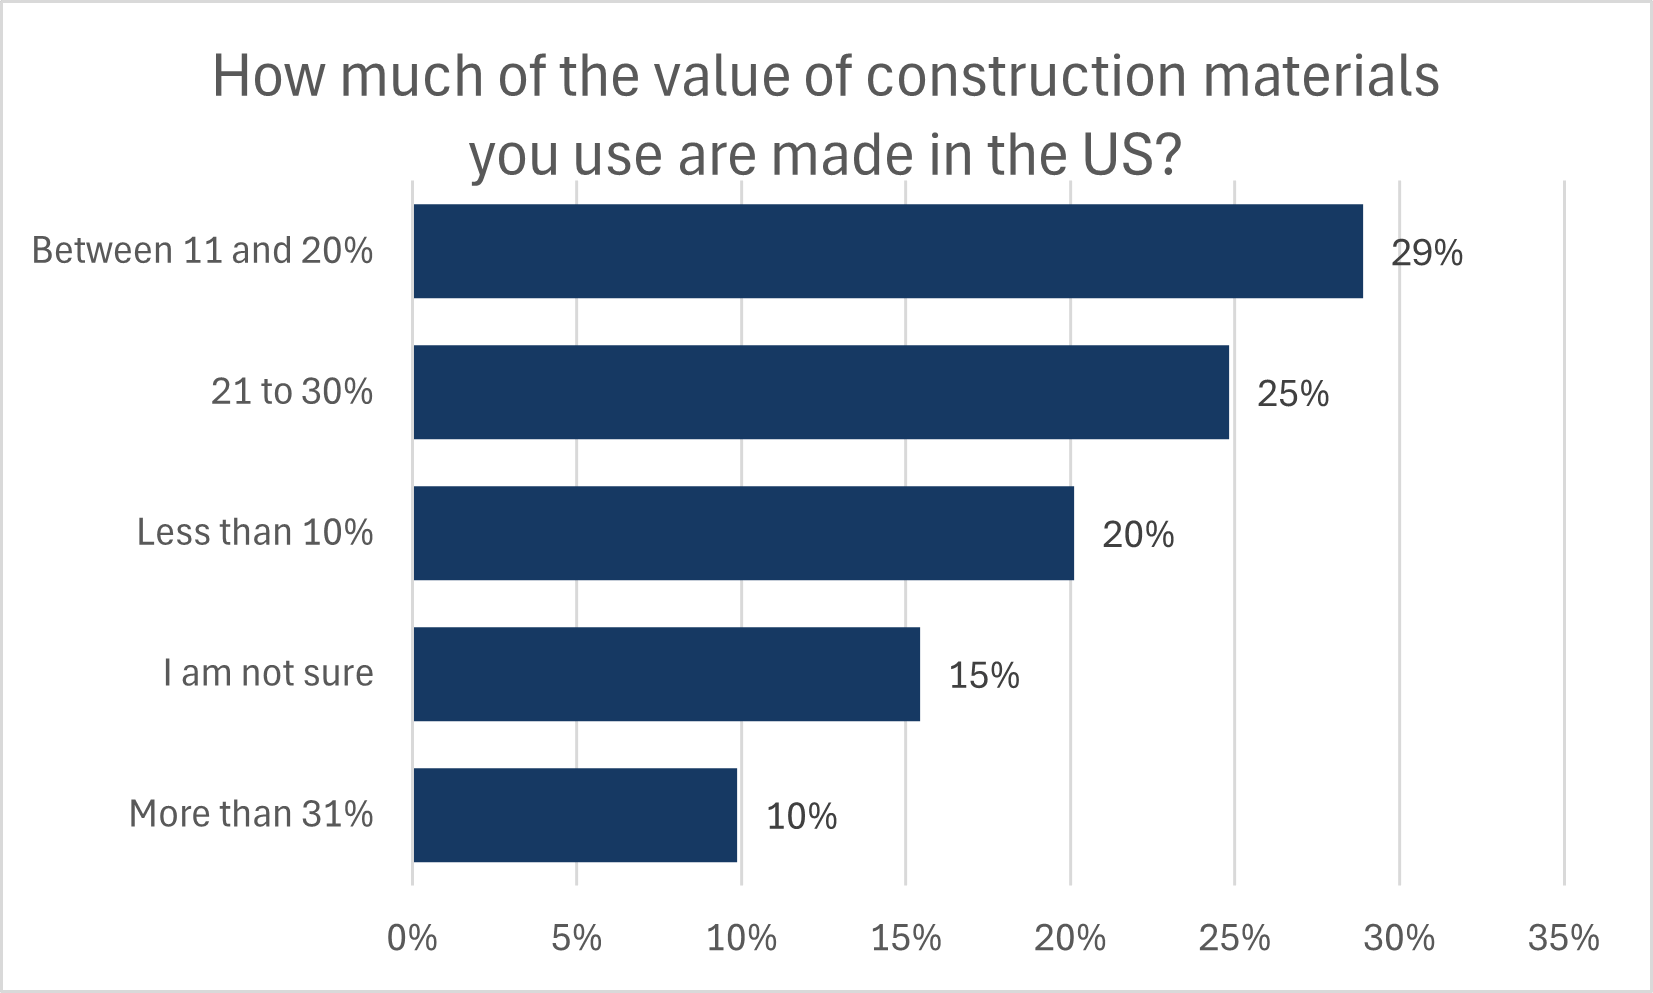
- To help judge the impact of tariffs on building construction, builders were asked to provide an estimate of the proportion of the value of total building materials that is made in the US. 29% of builders said that between 11 and 20 percent of the value of materials is made in the US, which was the most common answer. Just 10% said that more than 31% of the value of materials comes from the U.S. In general, most products can be sourced domestically or imported from non-U.S. trading partners. However, this is not a certainty, as country of origin has been less of a factor under free trade.
- Canada has implemented tariffs on $30 billion worth of U.S. product imports, including most large kitchen and/or laundry appliances. 75% of builders state that they supply these appliances in their purchase agreements, however a large portion of builders were not sure if these appliances simply came from the U.S. or were a product made in the U.S. After removing the builders who were unsure, on average, 53% of the large appliances supplied by these builders are believed to be subject to tariffs on U.S. products
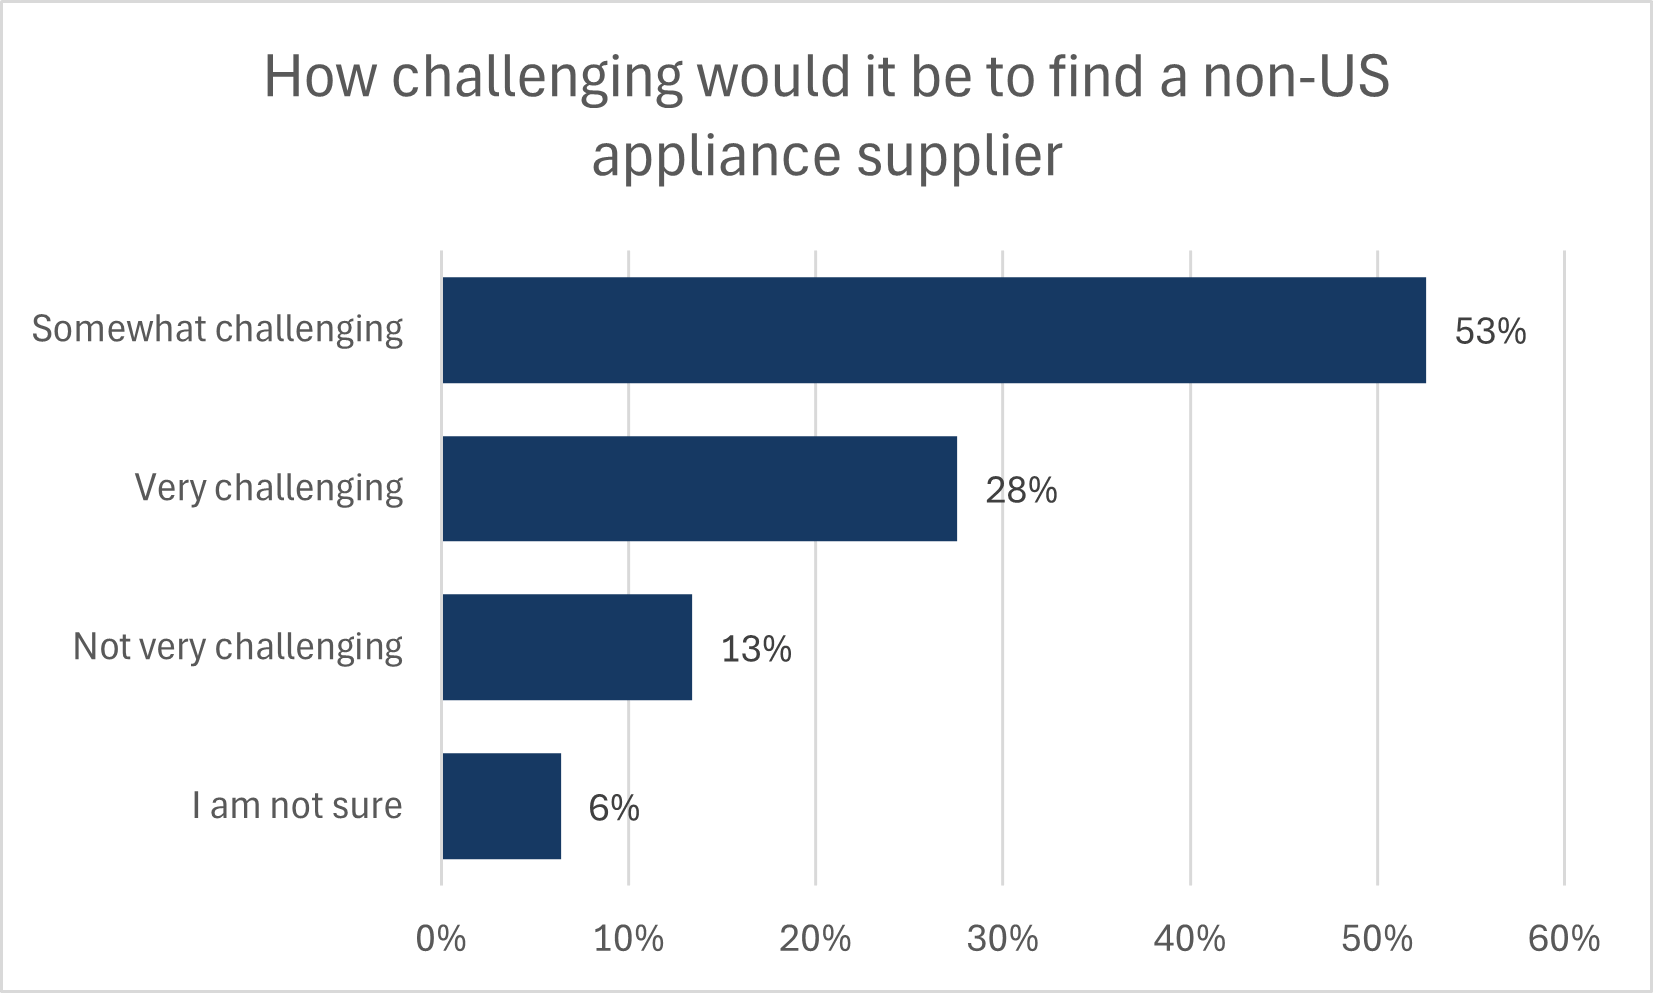
- 53% of builders believed finding non-U.S. appliance suppliers will be somewhat challenging and a further 28% believe it will be very challenging. CHBA has advised government officials that additional overseas production is often geared towards smaller standards of Europe and Asia, making additional sourcing problematic.
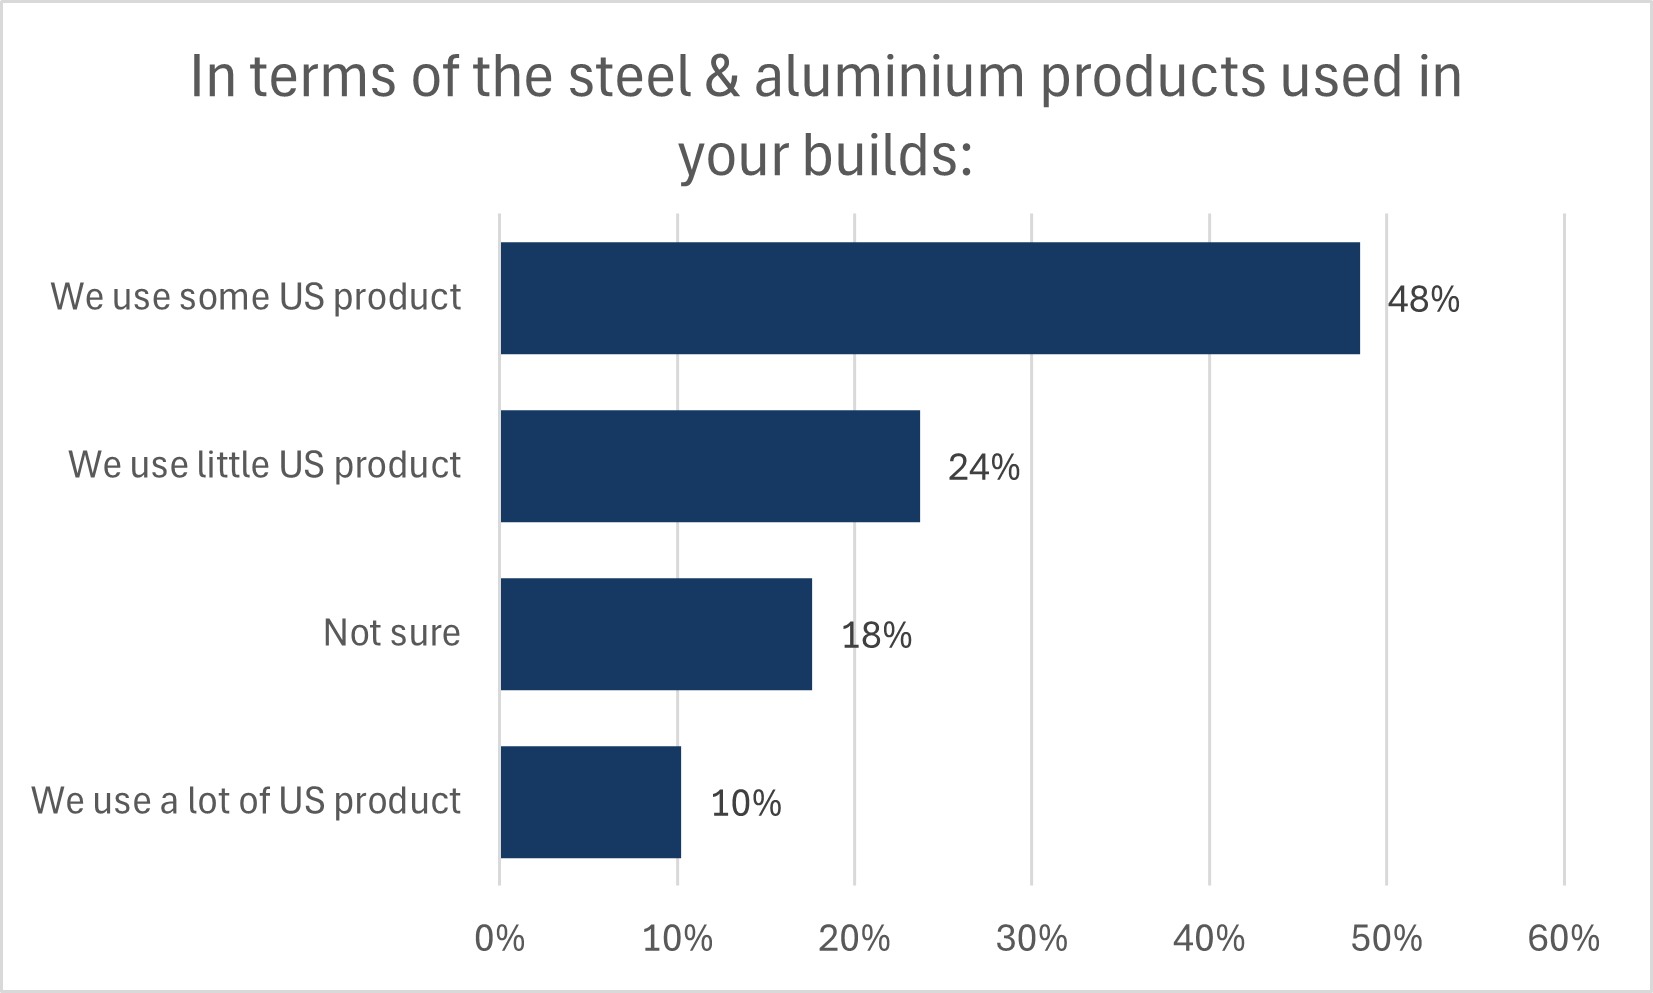
- In response to the U.S.’s global tariffs on steel and aluminium as well as products made of these materials, Canada has implemented counter tariffs on these goods in return. Understanding the difficulty in estimating the level of U.S. product, builders were asked to subjectively judge how much U.S. steel and aluminium they use in construction. 48% of builders stated that they use some U.S. product and 24% said they use a small amount of U.S. product.
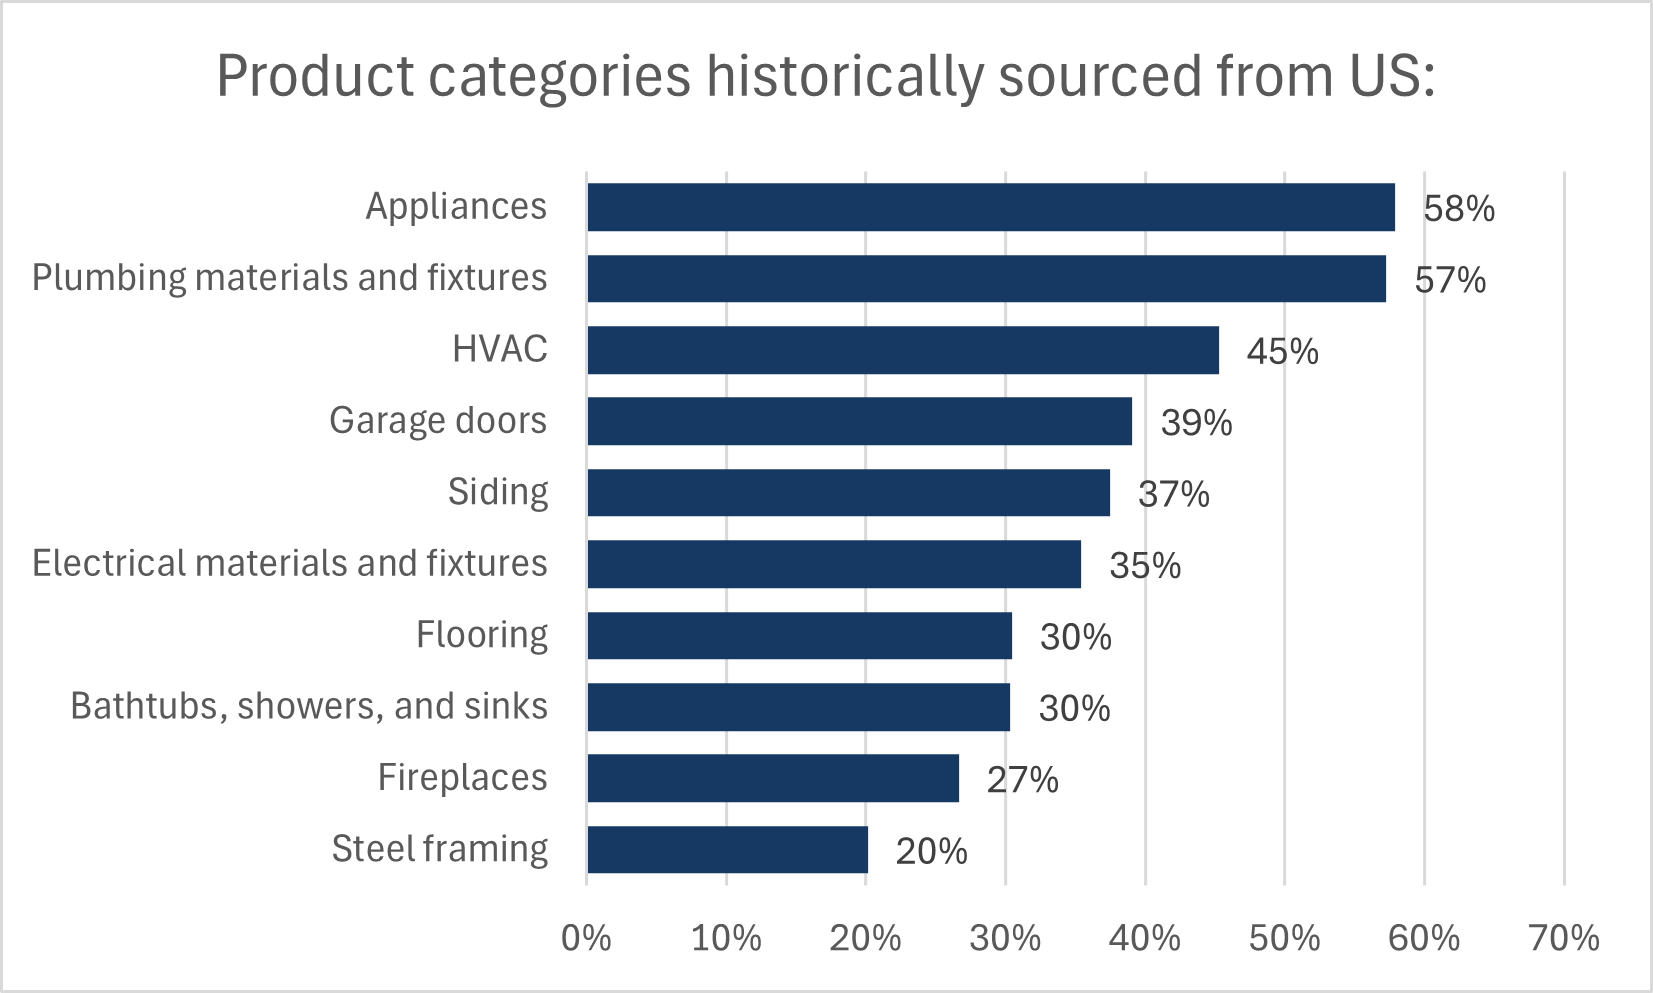
- Many other building materials are contained within the $125 billion Phase II list of counter tariffed goods, which could still be implemented, depending on U.S. tariff announcements going forward. Builders were asked to identify any broad building material categories that they have historically sourced from the U.S. Among the most exposed product categories to U.S. imports, according to builders, were appliances and plumbing products at 58% and 57% respectively.
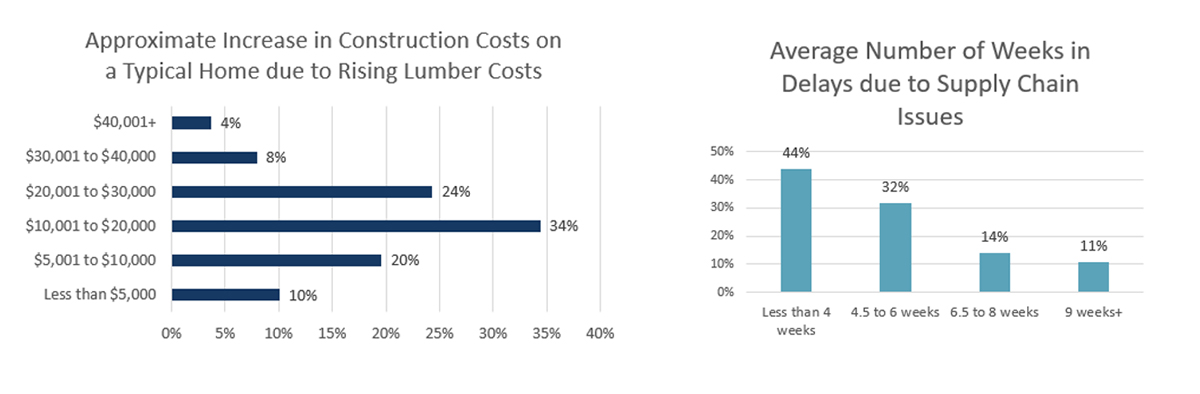
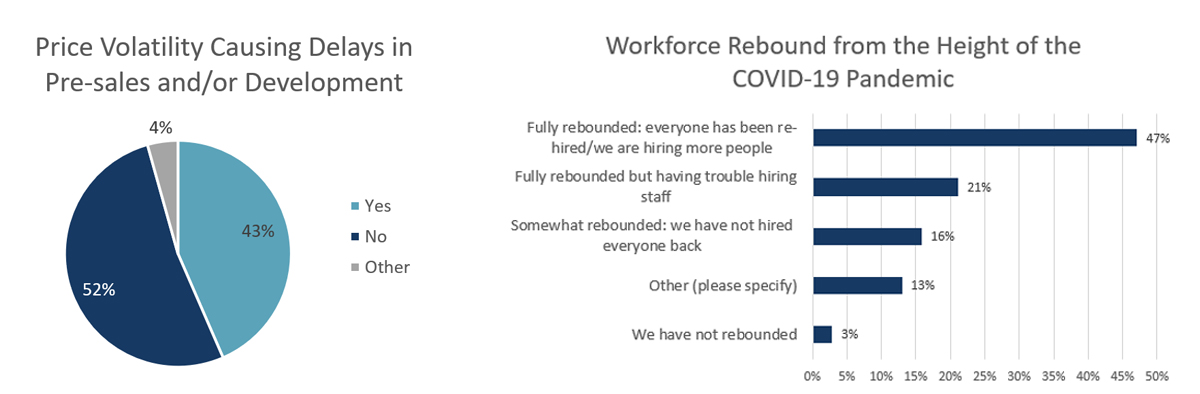
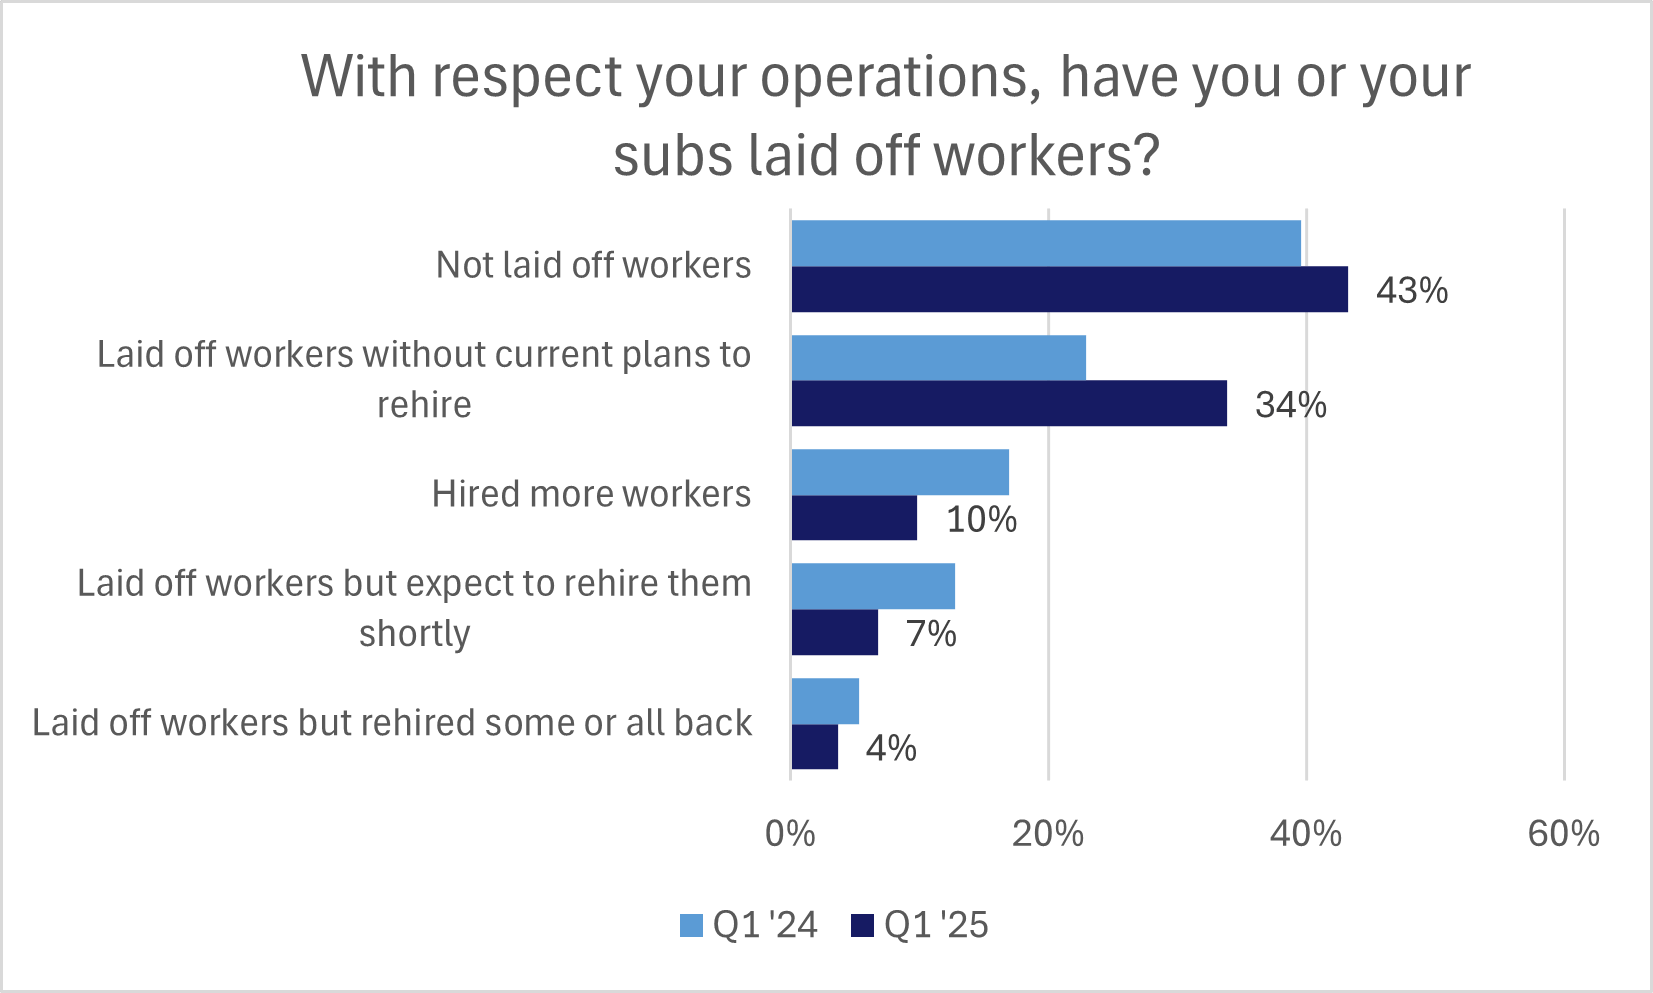
- CHBA remains concerned about the risk that the global trade shock will lower economic growth in Canada and weaken new home buying demand further. While builders prioritized keeping staff through the period of high interest rates, Q1 shows signs that a lack of sales has begun to necessitate layoffs. While 43% have still not laid off workers, 34% have, with no immediate plans to rehire, a proportion that is 11 percentage points higher than the response rate from a year ago.
- The rapid and compounding rise in building costs have also worked against affordability, which will be exacerbated by tariffs directly on building materials. Builders were again asked to estimate the increase in cost of non-lumber construction materials over the past year. Based on this, the average non-lumber material cost to build a 2,400 square foot home has risen over $70,000 since the start of the pandemic in 2020. When including cumulative lumber cost increases, total material costs have risen by nearly $98,000 to construct a 2,400 square foot reference home relative to early 2020.
- Single-family builder confidence was 25.1 in the fourth quarter of 2024. This is a decline of 2.3 points from the previous quarter and is just 0.5 of a point above the index’s all-time low of 24.6 recorded a year ago.
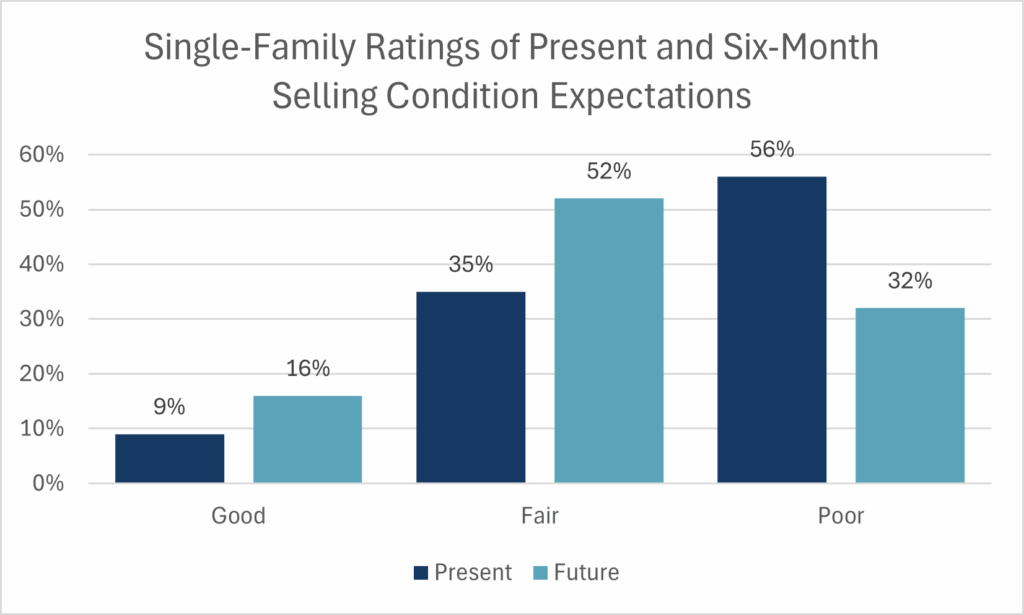
- 56% of single-family builders rated current selling conditions as Poor. The majority have given this rating in four of the past five quarters.
- With respect to expectations for sales over the next six months, builders maintain some optimism for improvement with 52% rating their expectations for conditions to be Fair. 32% still expect conditions to be Poor over the near future.
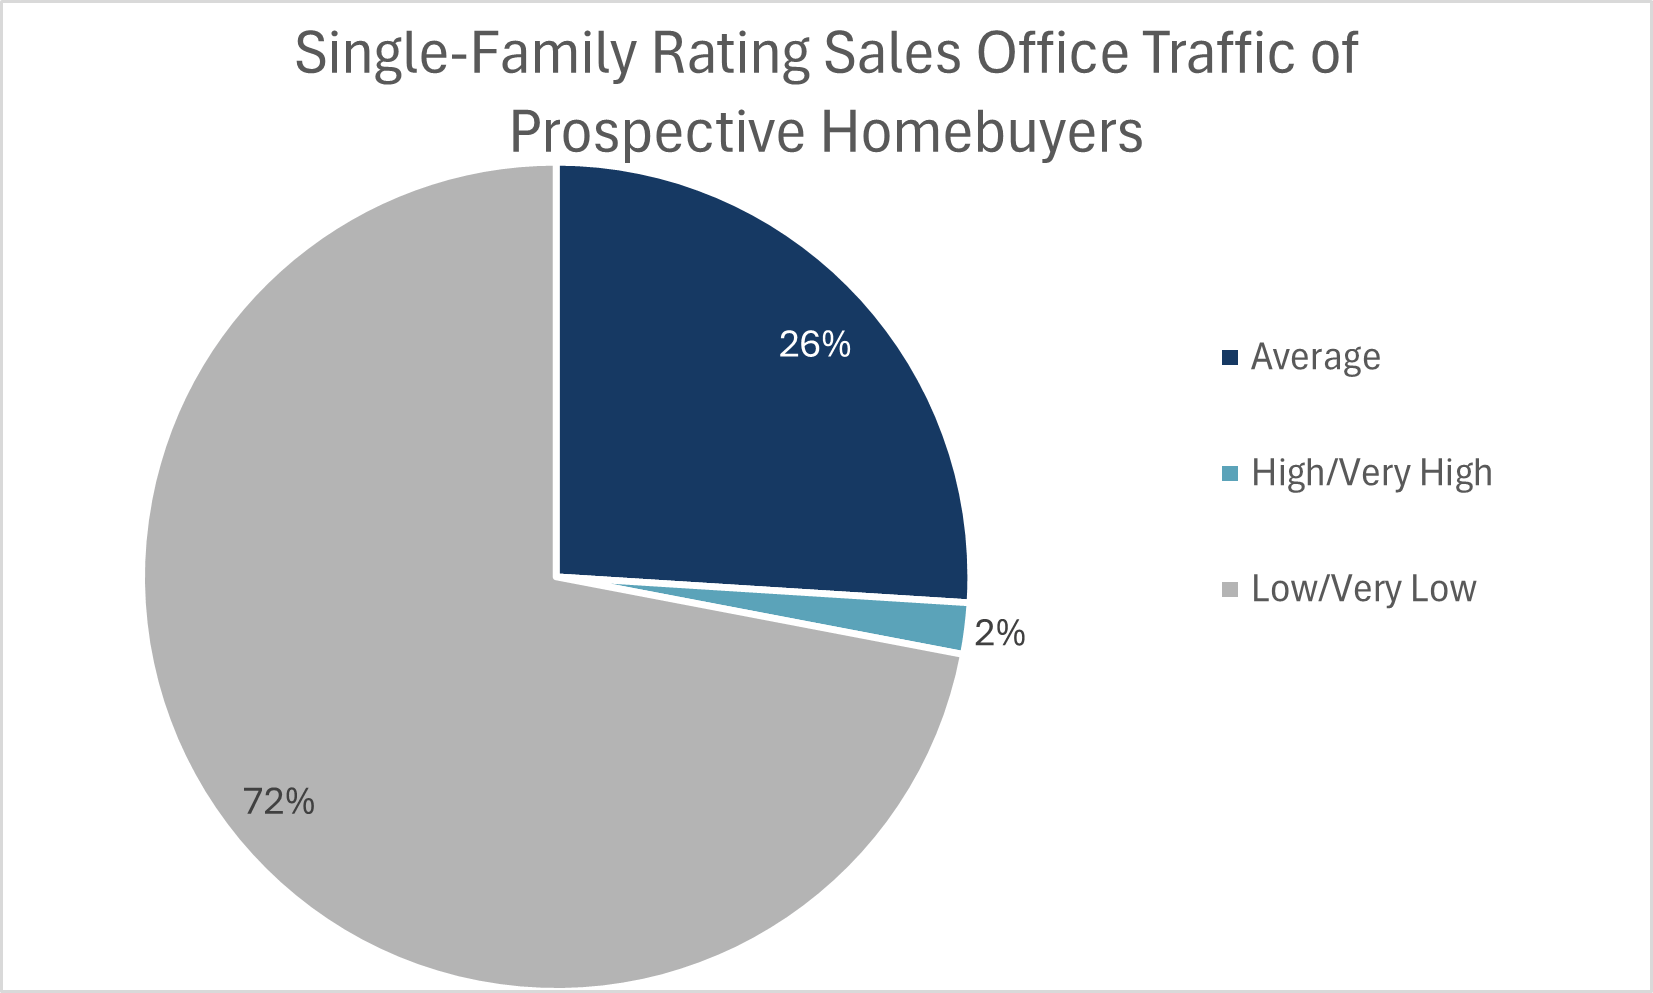
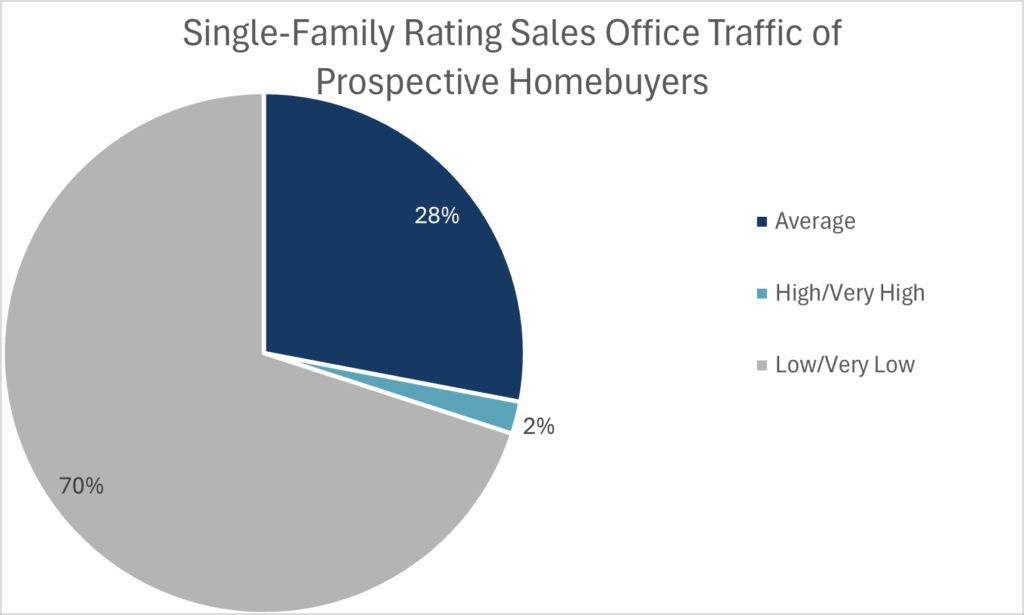
- Ratings of sales office traffic and potential buyer inquiries remains weak. 70% rate their level of traffic as Low or Very Low. Only 2% of the survey respondents rated traffic as High or Very High.
- Comparatively, the NAHB/Wells Fargo HMI for US single-family builders recorded an average score of 45 in the fourth quarter. While still pessimistic, the balance of builder views is far closer to neutral than in Canada.
- Regional differences persist in the four regions tracked by the survey. Builder sentiment in Ontario reaching an abysmal 11.3, reflecting near universal current sales pessimism in the province. However, this quarter was marked by British Columbia’s sharp decline in sentiment for single-family sales, falling below that of Ontario for the first time since 2021, by reaching a score of 10.5. In contrast, builder sentiment in the Prairie Provinces was 48.2, which is 18.8 points higher than recorded a year ago. Sentiment in Atlantic provinces fell for a third consecutive quarter and recorded a neutral reading of 44.9.
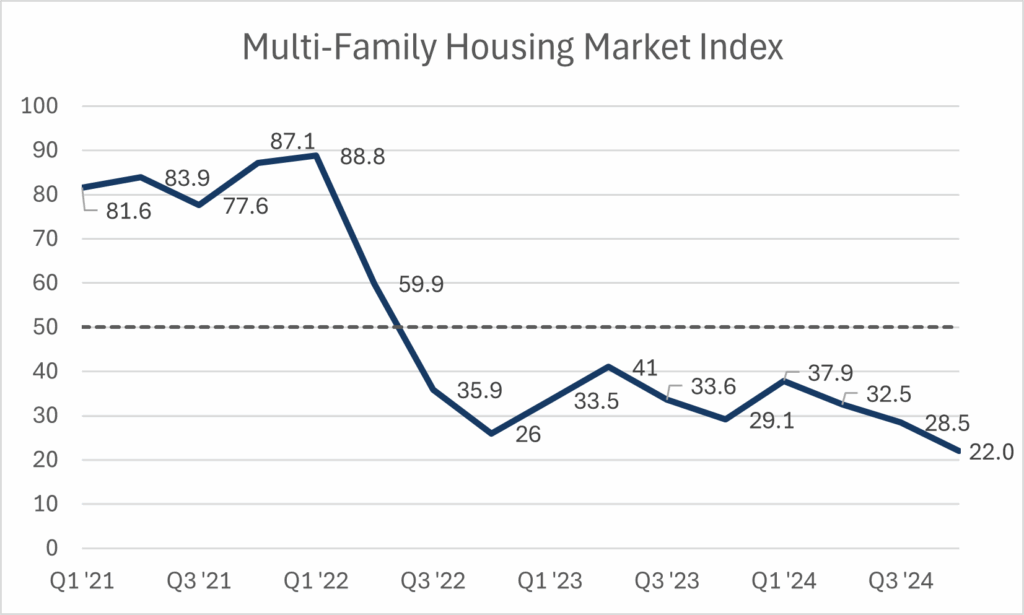
- The multi-family Housing Market Index result was 22.0 in the fourth quarter of 2024, falling 6.5 points from the previous quarter and 7.1 points from Q4 2023. Unfortunately, this quarter was a new record low, surpassing Q4 2022’s score of 26.0.
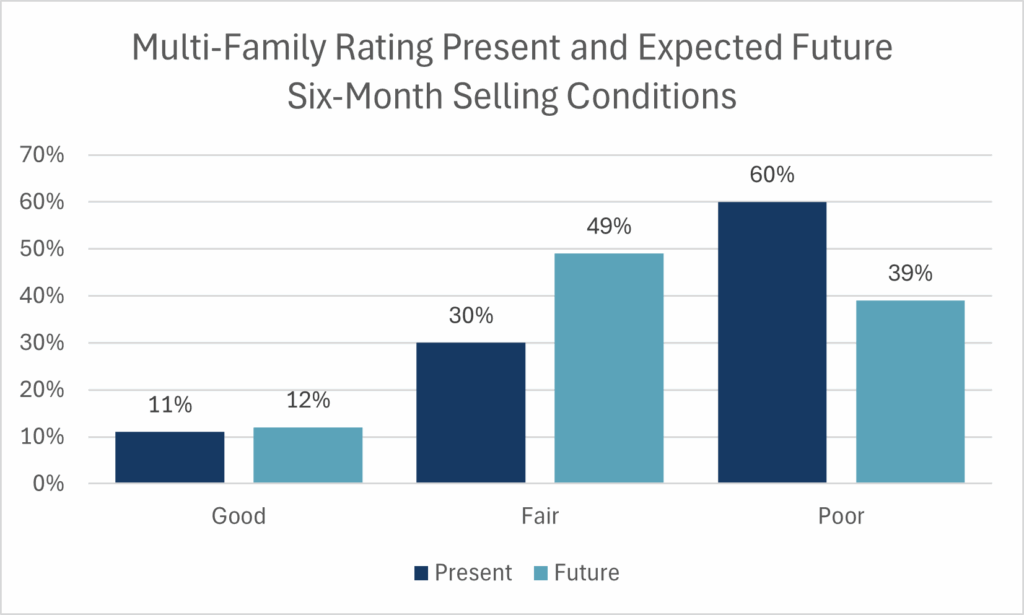
- A record-high 60% of builders rated current multi-family selling conditions as Poor, a 7-percentage point jump over the fourth quarter of 2023.
- 50% of builders reported their expectations for sales over the near future to be Fair, while 39% expect conditions to be Poor.
- The drop to a record low in the multi-family HMI this past quarter was the result of responses to sales office traffic and sales inquiries. 81% of respondents rated traffic and inquiries as Low or Very Low and lowered the traffic sub-index to unprecedented weakness.
- The Ontario multi-family HMI was 6.2, a new all-time low, down from 21.3 at this time last year and from an all-time high of 90.7 in Q4 2021. No builders in Ontario gave a rating of Good or High/Very High. British Columbia recorded a score of 25, progressively lowering from 42.9 in Q1 2024. The Prairies Provinces recorded a score of 53.7, notably falling from scores of 73.2 in Q2 2024 and 64.3 in Q3 2024.
The results from these questions allow CHBA to better understand what is driving change in builder sentiment as well as monitor current industry issues.
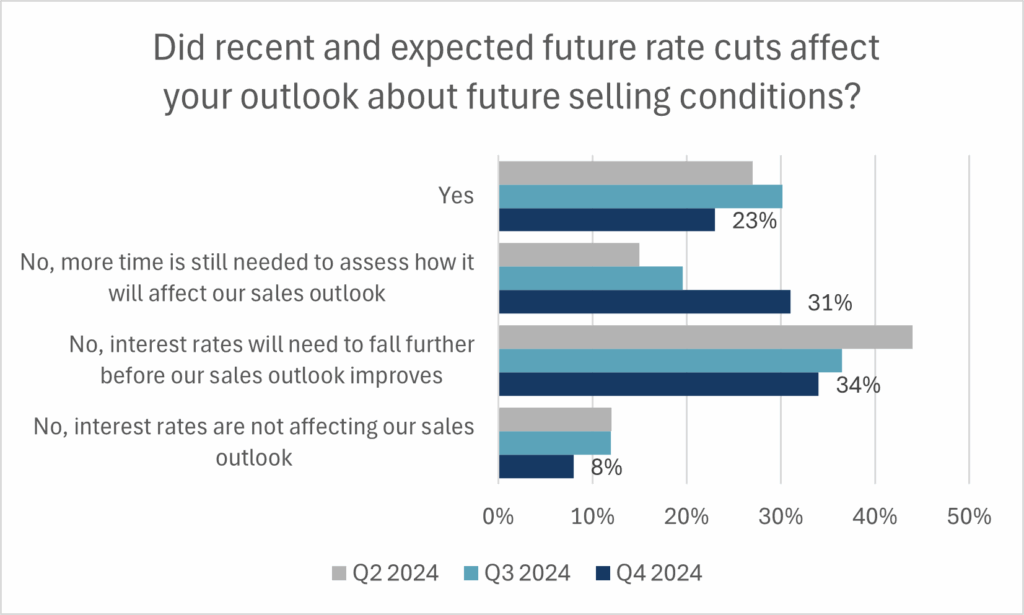
- The Bank of Canada delivered a fifth consecutive rate reduction in December, while the survey was in field, totalling 1.75 percentage points of reductions to short term interest rates since June. Builders were again asked if the BoC’s reductions influenced their expectations about future sales. 34% stated that rates need to fall further before they would it would give them reason to raise their outlook. While there was an initial drop in fixed mortgage rates in Q4 2023, average fixed mortgage rates fell about 0.8 percentage points over the second half of 2024 and kept the mortgage stress test above the default 5.25% Minimum Qualifying Rate. 31% of builders said they would need more time to assess how this impacts their outlook, as the mortgage offerings adjust with the longer-term bond yields. 23% of builders said Yes, it did improve their sales outlook, but this proportion was down from the previous two quarters.
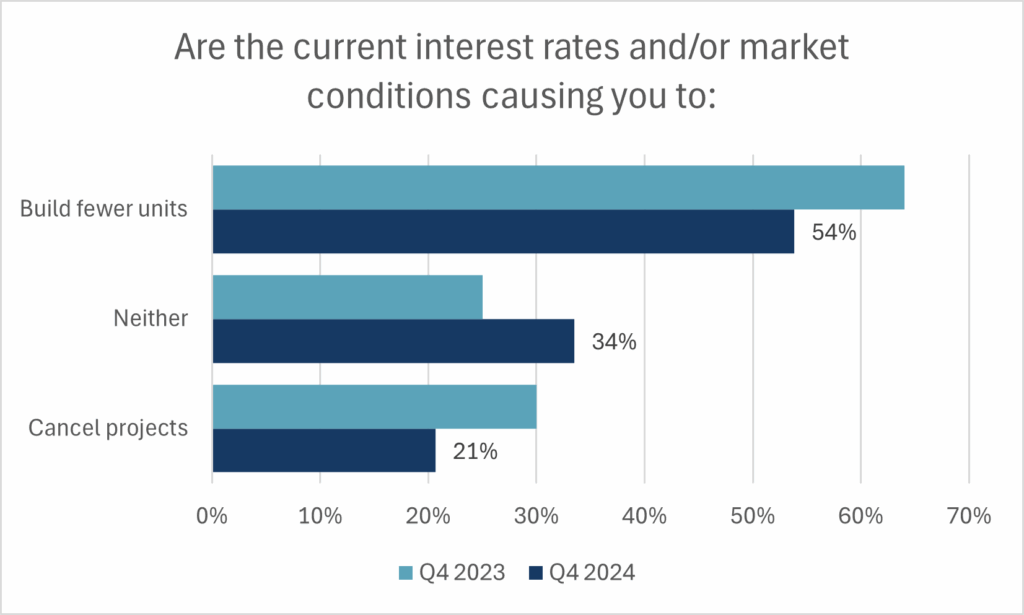
- While national sales conditions remain weak, regional difference highlighted in builder sales sentiment will also extend to construction activity. Most builders state that the interest rates and general economic conditions are still restricting their starts to some degree. Responses from builders stating that interest rates are not restricting their construction came primarily from Prairie and Atlantic province builders, where pre-existing affordability was and continues to be more conducive to sales.
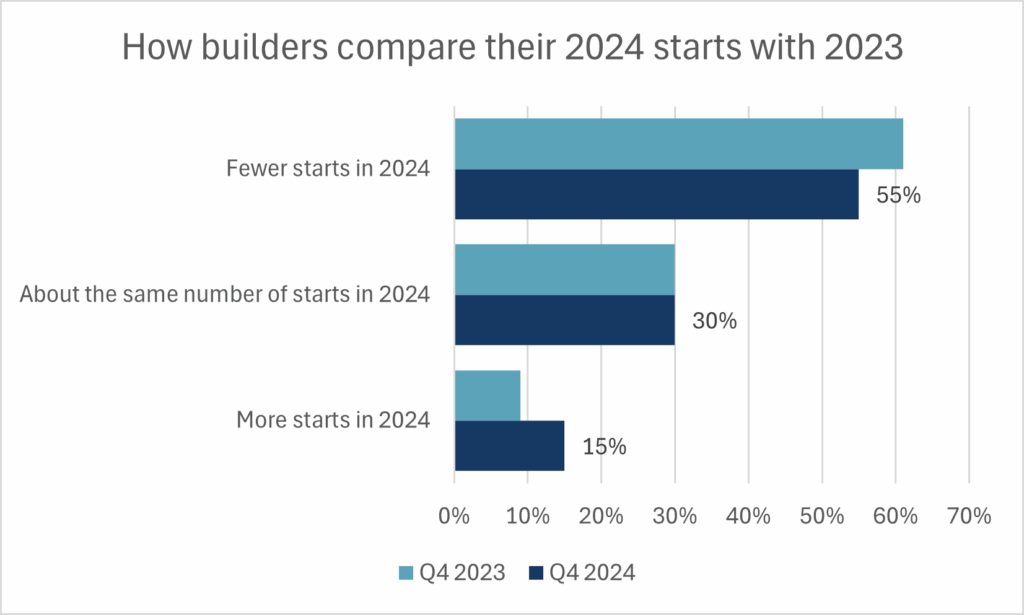
- The majority of respondents stated that they had fewer housing starts in 2024 than they did in 2023. On average these builders stated they reduced their starts by 50% relative to 2023. Note that this does not account for the magnitude of change in starts. Out of the builders that stated they had more starts in 2024, the majority were based in the Prairie Provinces.
- -To continue monitoring the escalation of construction costs, builders were asked about their non-lumber material costs relative to a year ago based on the most typical home they build. Based on the average of responses, the price increases of materials excluding lumber have added $36,000 to the cost of constructing a 2,400 square foot home, relative to the end of 2023.
- Softwood lumber prices spiked in Q4, increasing lumber material costs by over $4,200 relative to a year ago and $30,000 since the start of 2020 to the construction cost of a 2,400 square foot home. CHBA remains engaged in policy discourse over the effect of compounding broad based tariffs on lumber and the possibility of additional lumber curtailment.
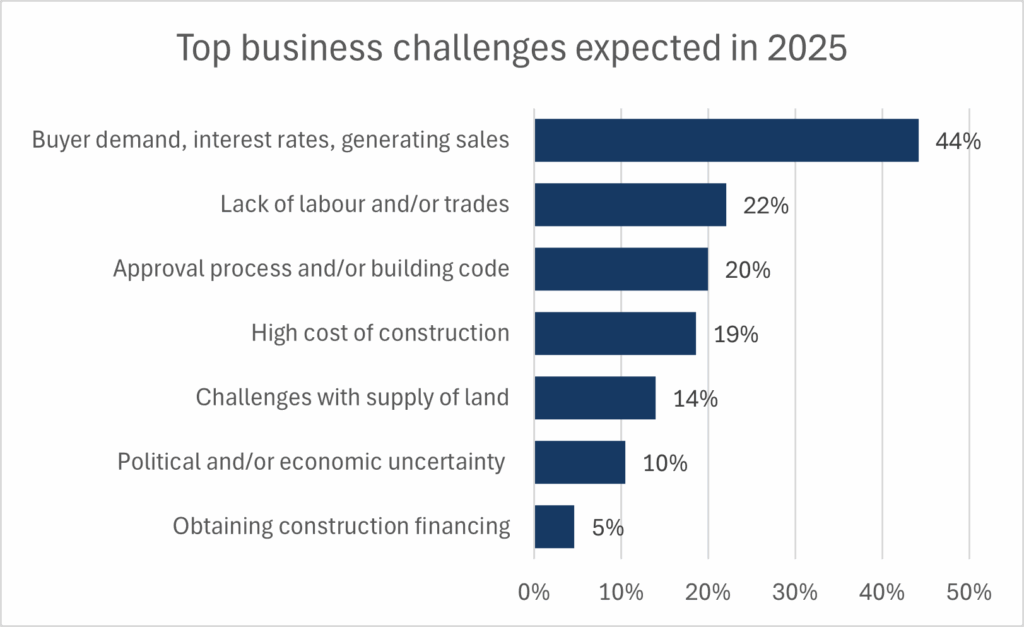
- Builders were asked, without a list to choose, what they expect the top challenge for their business will be in 2025. Comments were categorized into 7 main categories. 44% of builders stated getting their regular flow of sales back will be their top challenge. After this, there was a near-equal proportion of builders mentioning challenges of finding qualified trades, issues with the building approval process or codes changes, and their high construction costs specifically that make sales challenging. 14% of builders stated that issues with obtaining enough suitable lots or obtaining land at a viable price will be a top challenge. For reference, when asked in Q4 2023 about what the most acute issues would be if buyer demand was better, they were: municipal processes (46%), lack of labour (39%), and access to land (33%). Note: The first two issues stated were counted in cases where multiple issues were stated. Since issues related to a lack of sales remain the top issue for 2025, answers regarding the cost of construction being why they continue to expect low sales were recorded separately.
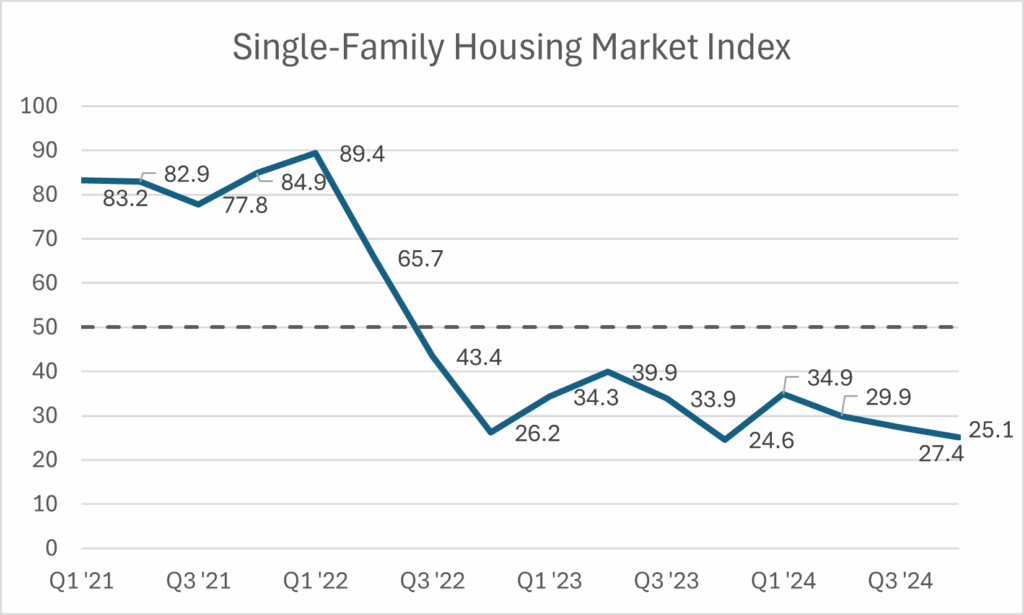
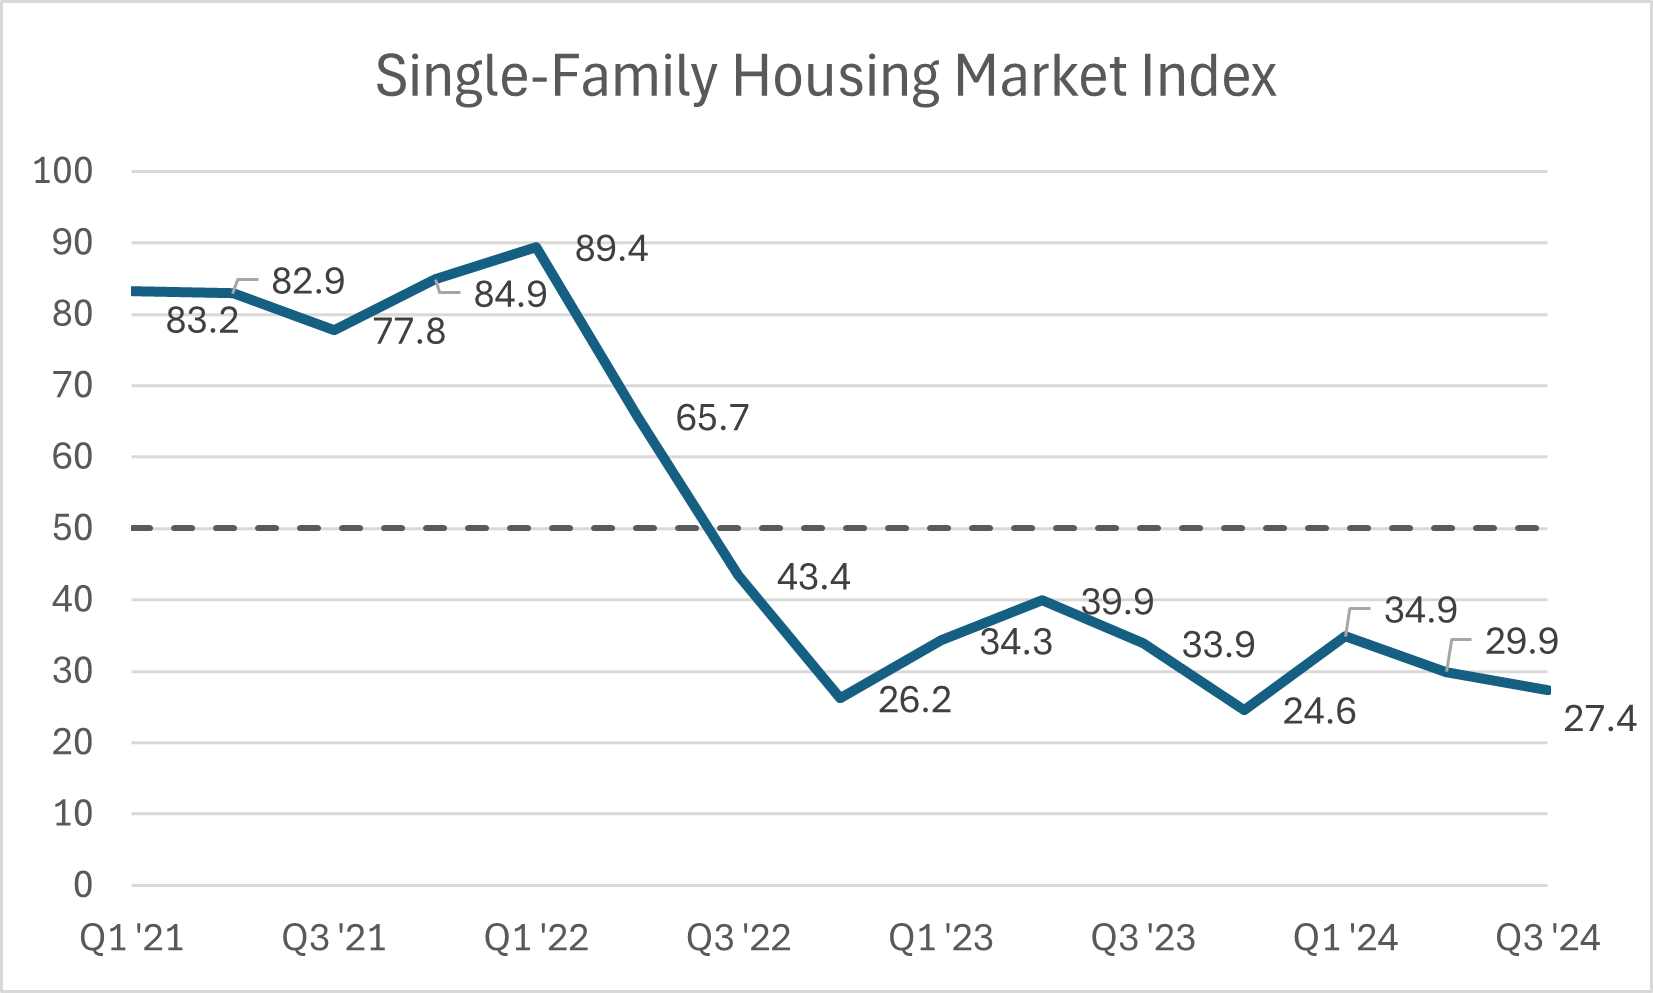
- The single-family Housing Market Index recorded 27.4 in the third quarter of 2024. This is 2.5 points lower than the previous quarter and 6.5 points lower than in Q3 of 2023. The single-family HMI has retrenched to just 1.2 points above its record low of 26.2 recorded in Q4 2022.
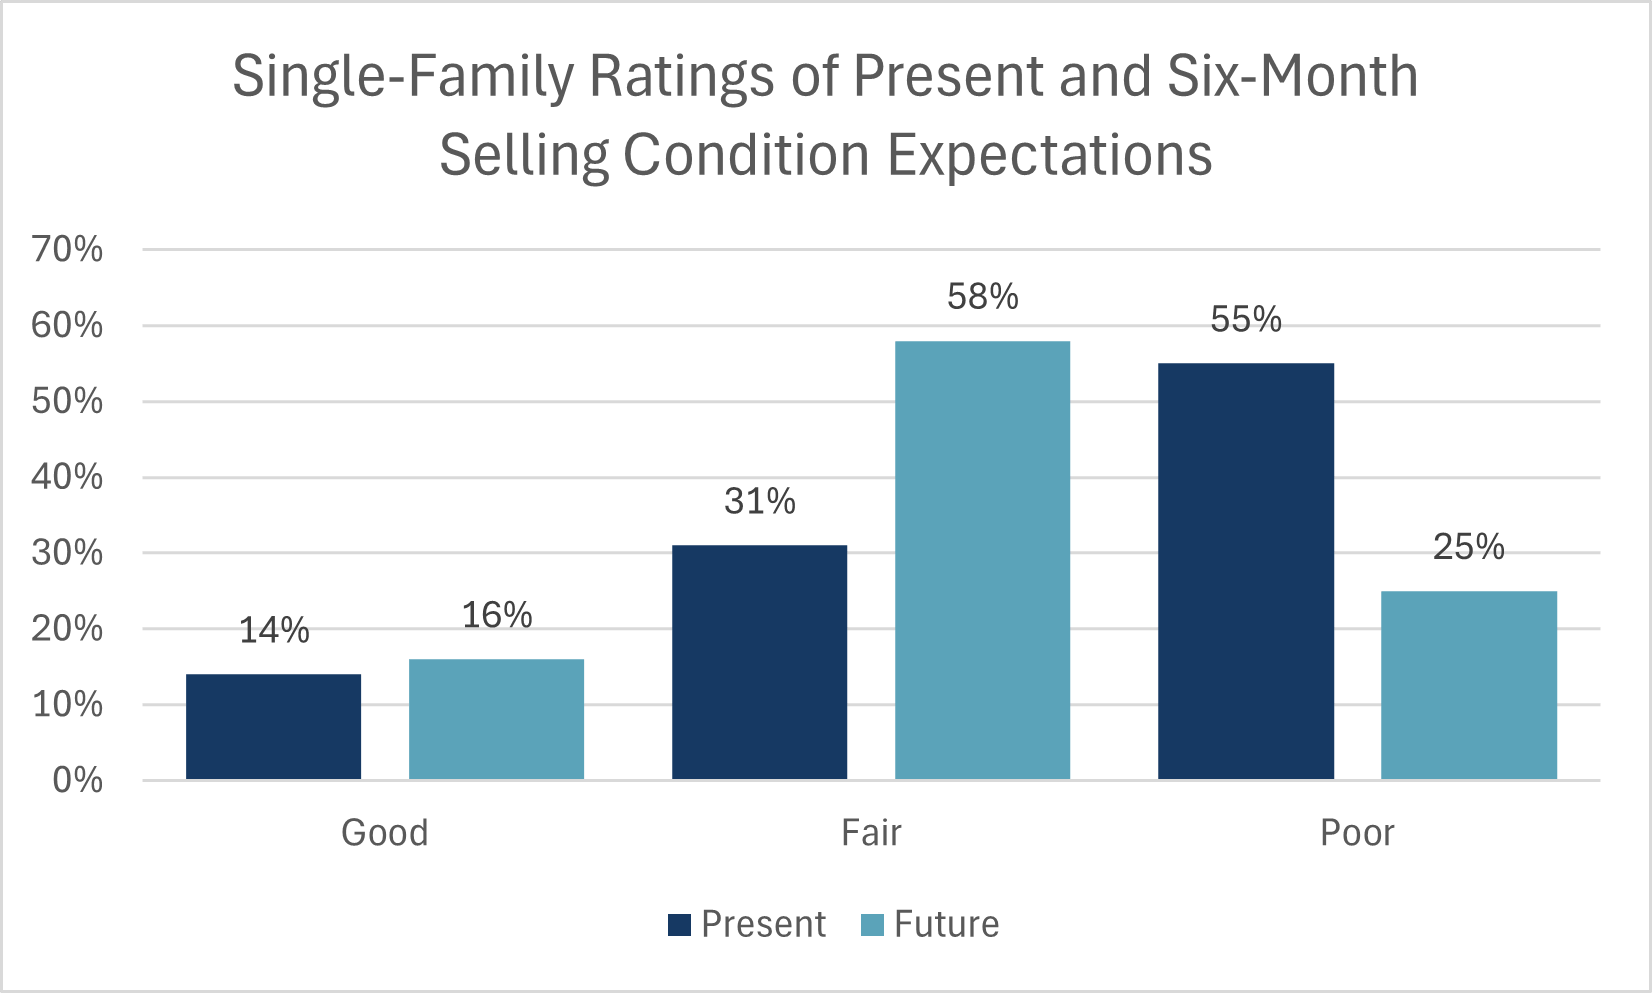
- Over 55% of single-family builders rated current selling conditions as Poor. This majority pushed down the present selling conditions sub-index to just 1.1 points above its all-time low recorded in Q4 2024.
- 58% of builders believe that selling conditions over the next six months will be Fair, while 25% still feel conditions will be Poor.
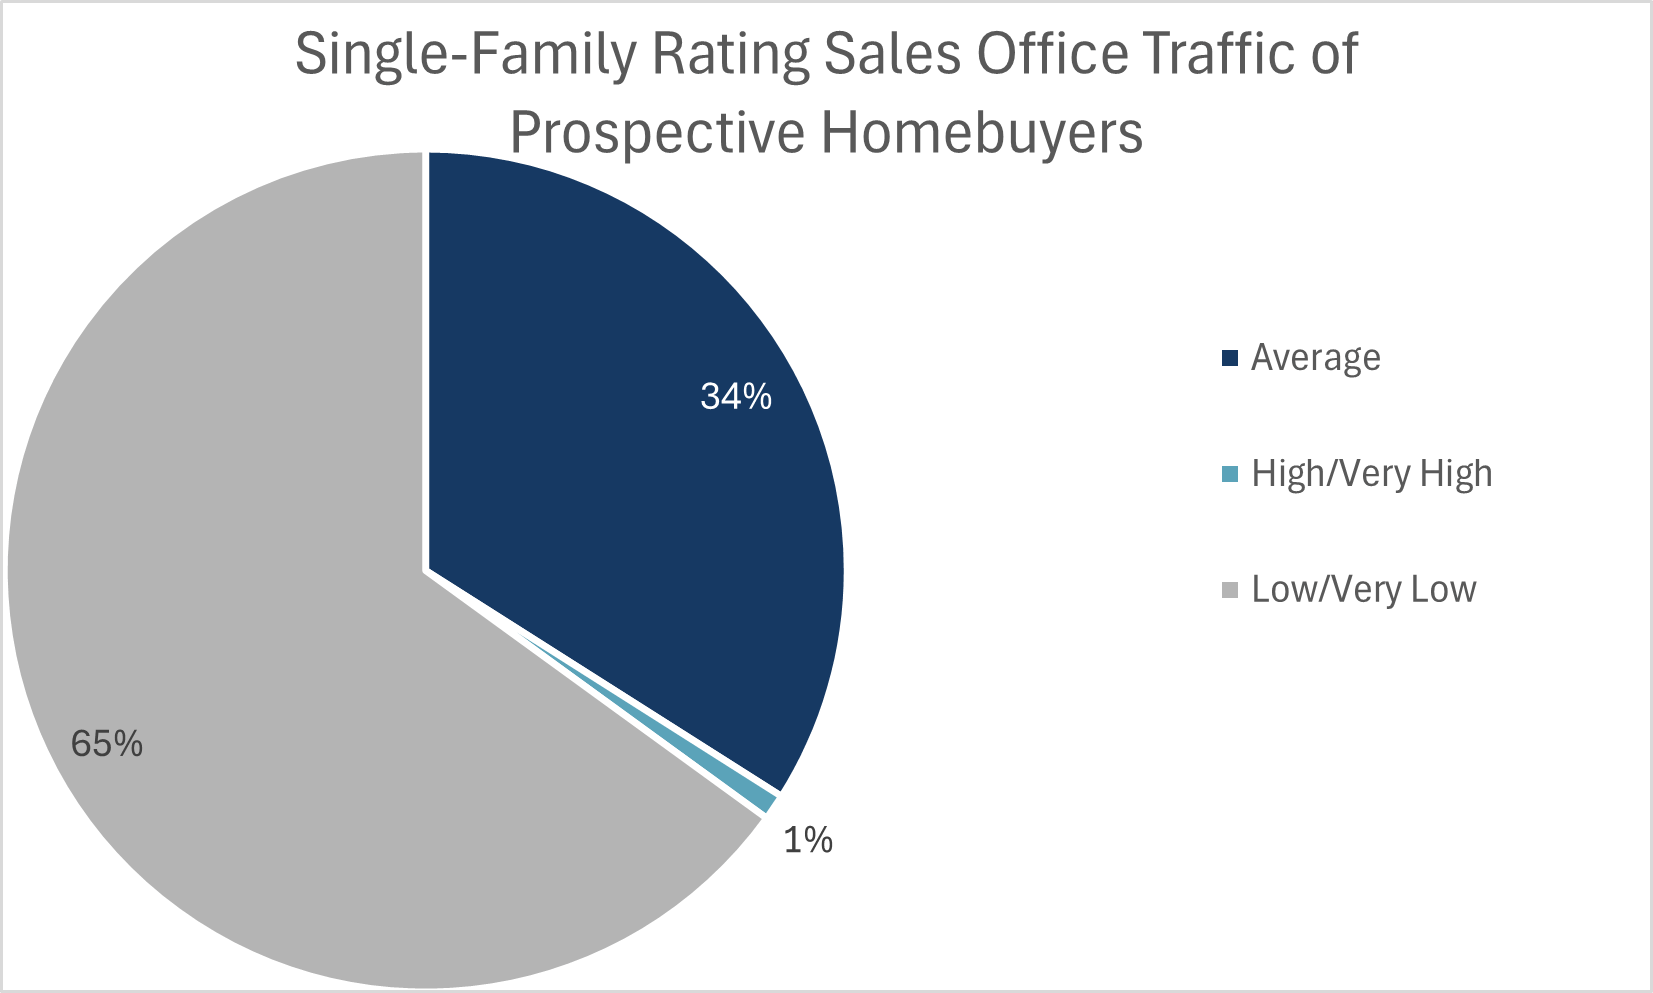
- 65% of single-family builders rated traffic through sales offices and general inquiries were Low or Very low. Furthermore, only one builder in the entire sample rated traffic conditions as High or Very High.
- The US NAHB Single-Family HMI for the third quarter averaged 40. The sentiment score in both Canada and the US has trended down by about 8 points since the first quarter of 2024. Yet Canadian builders have maintained a more pessimistic view going back to mid-2022.
- Regionally, single-family HMI in British Columbia edged down from 17.8 in Q2 2024 to 17.1, reaching a new record low for the second consecutive quarter. The HMI for Ontario builders remains terrible at 14.3 (up marginally from its its record low of 11.6 in Q2 2024) —still indicating abysmal sentiment on sales conditions. Meanwhile, sentiment in the Prairie and Atlantic provinces fell from their marginally optimistic readings to marginally pessimistic readings in the mid-40s.
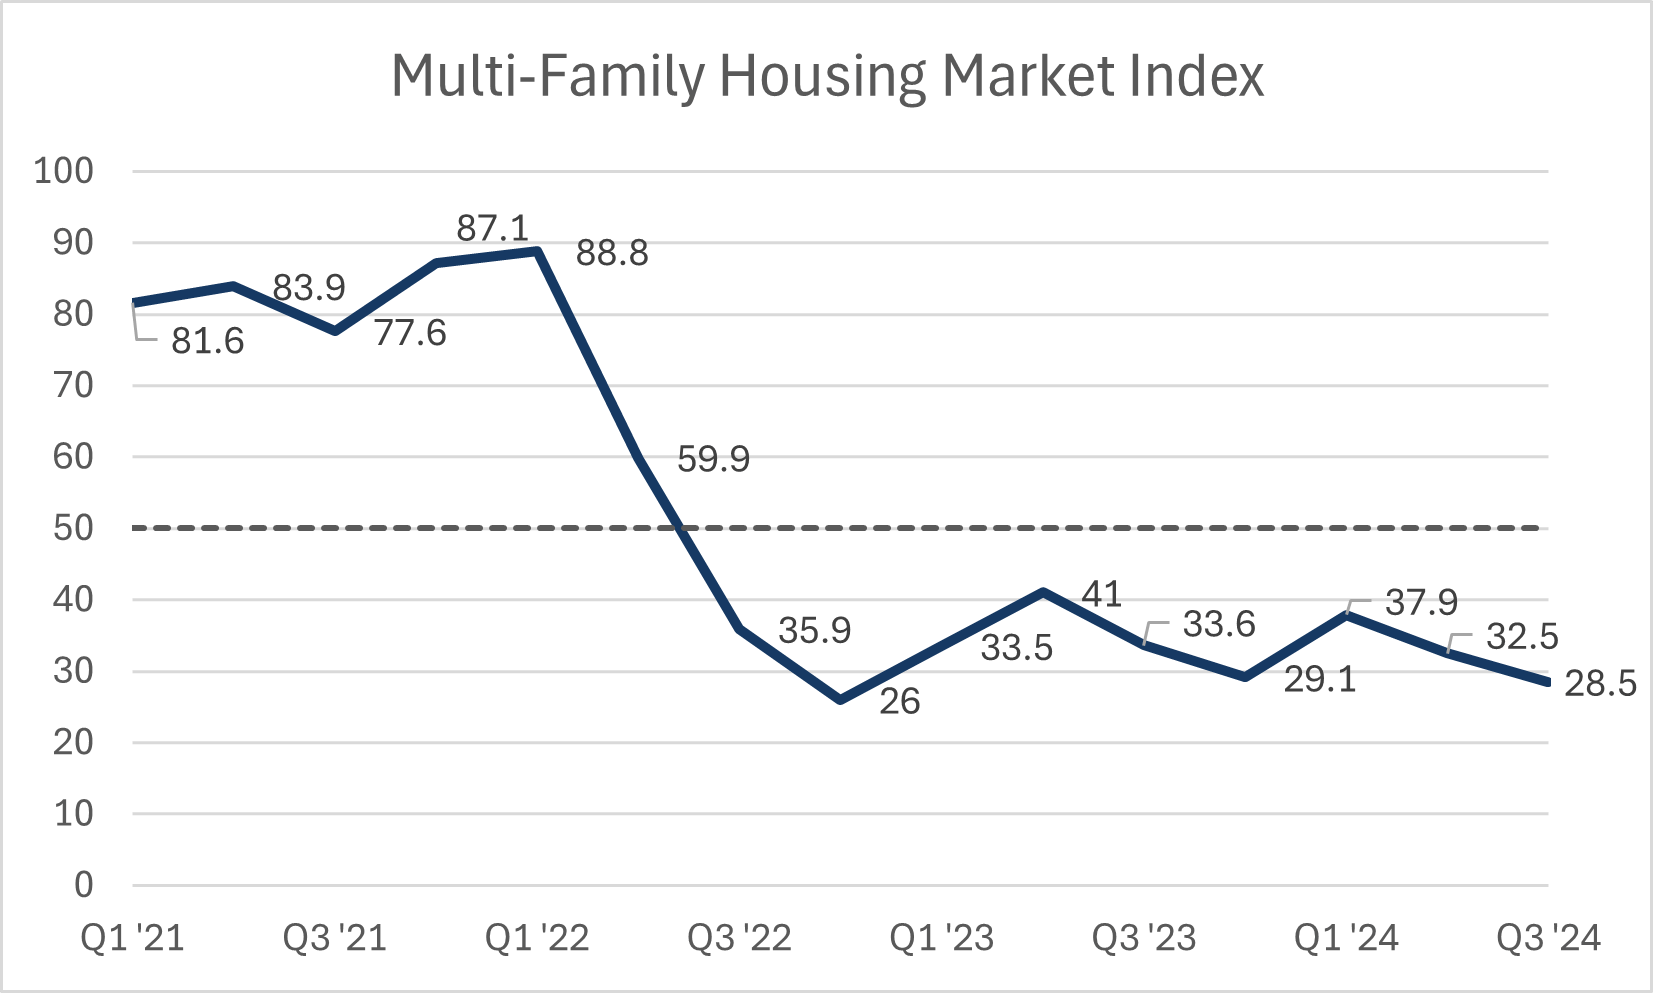
- The multi-family Housing Market Index recorded 28.5 in the third quarter of 2024. The index declined 4 points from Q2 2024 and 5.1 points from this quarter last year. This is the second lowest multi-family HMI reading on record, after it reached 26 in Q4 2022.
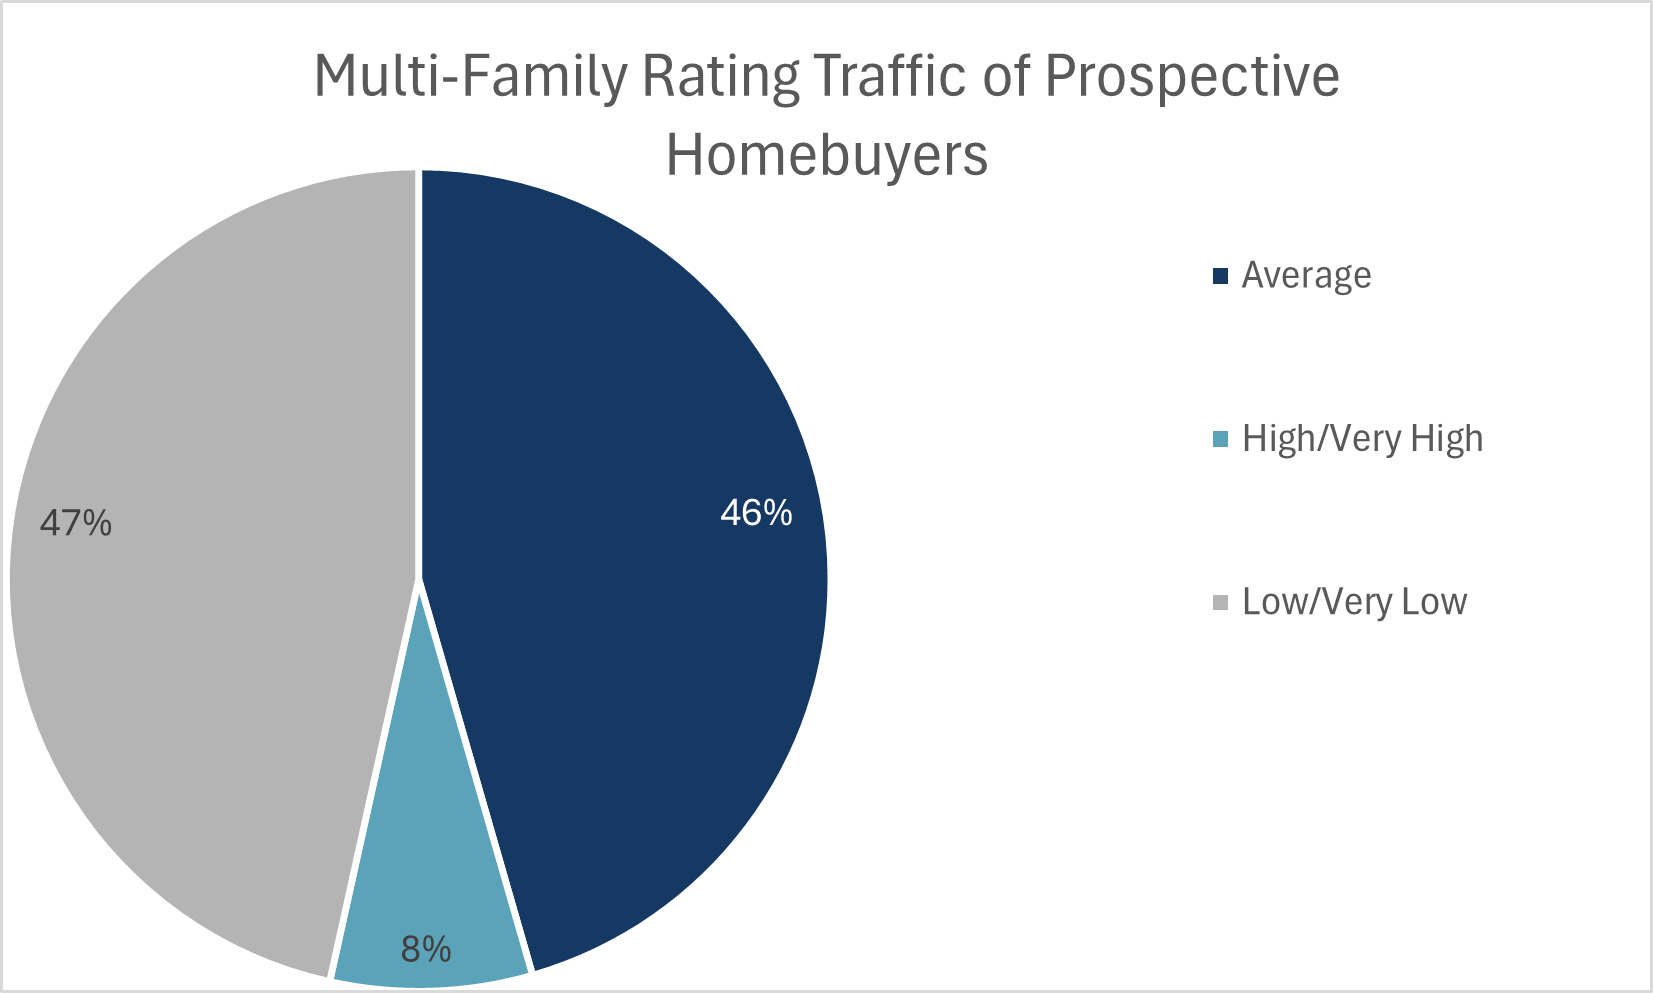
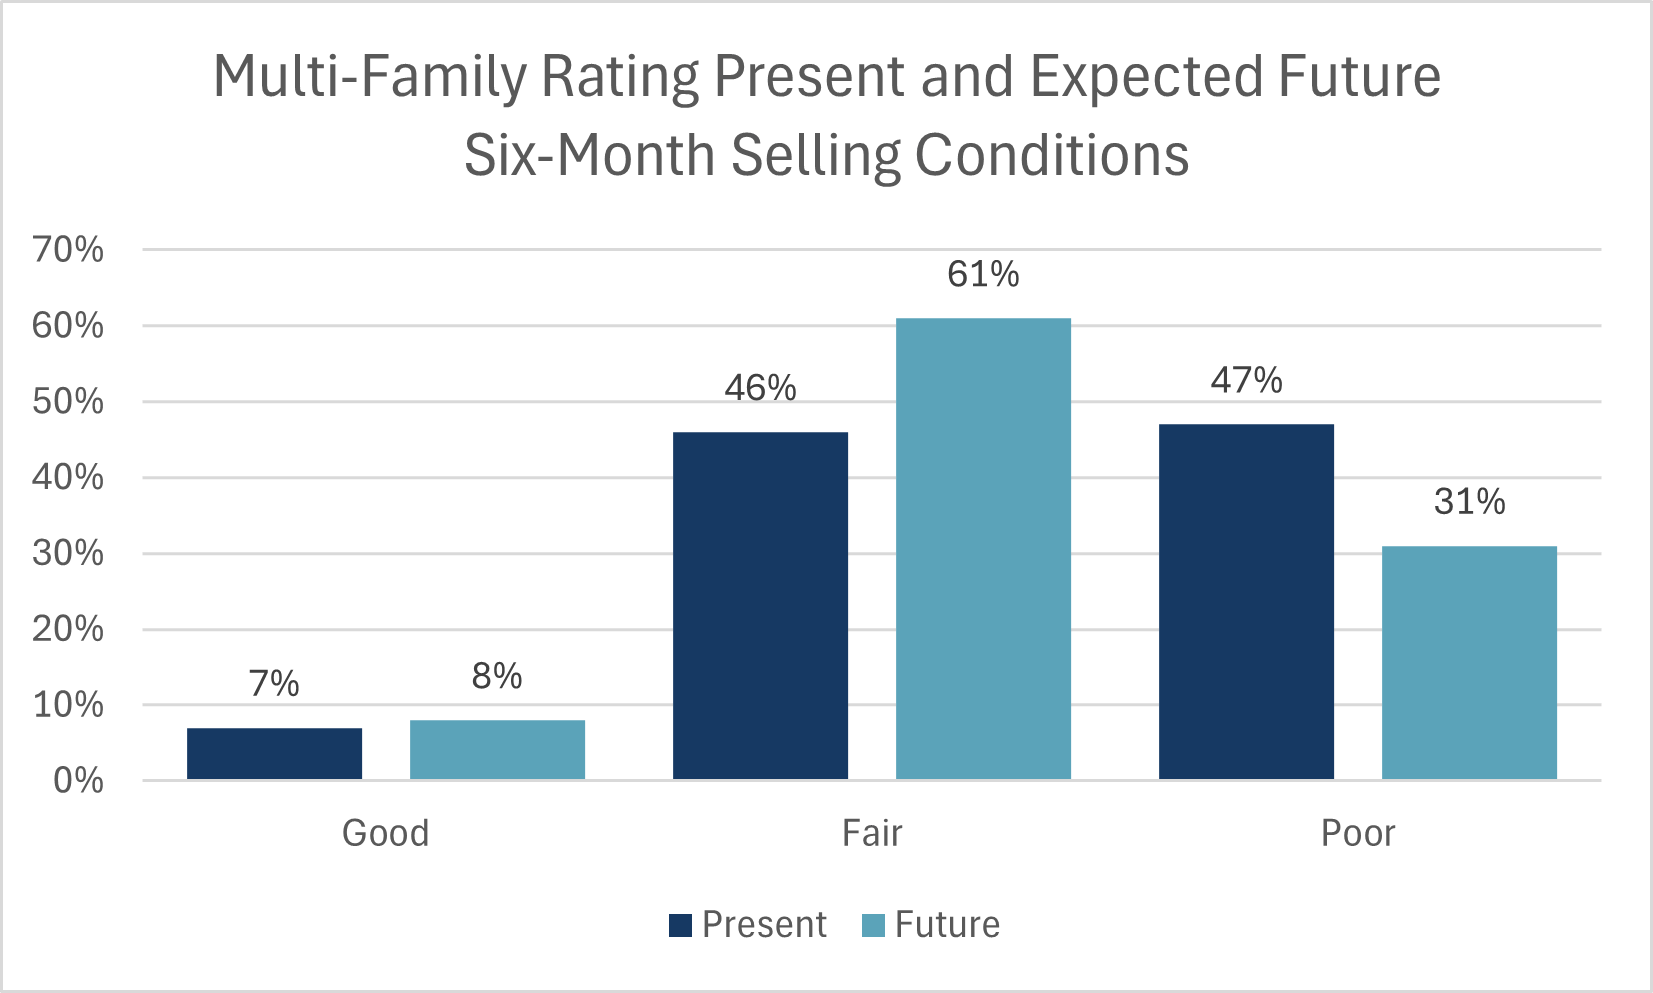
- 47% of multi-family builders rated current selling conditions as Poor and 46% rated conditions as Fair. For the first time, the proportion of builders rating conditions as Good was in the single digits
- 61% of builders rated their expectations for selling conditions over the next six months as Fair. Concerningly, this sub-index has softened in the last two quarters.
- 57% of builders noted that sales office traffic and inquiries were Low or Very Low. Similar to the single-family HMI, just one builder across the country rated traffic as High or Very High.
- Ontario continued to report lowest sentiment out of the four regions CHBA tracks, with a regional HMI of 12.5, nearly as bad as the record low of 11.6 recorded in the previous quarter. The Multi-family HMI in British Columbia was 29.3, a new record low for the province. Meanwhile, the multi-family HMI in the Prairie provinces was 64.3 in the third quarter, it is down from a score of 73.2 in the previous quarter.
The results from these questions allow CHBA to better understand what is driving change in builder sentiment as well as monitor current industry issues.
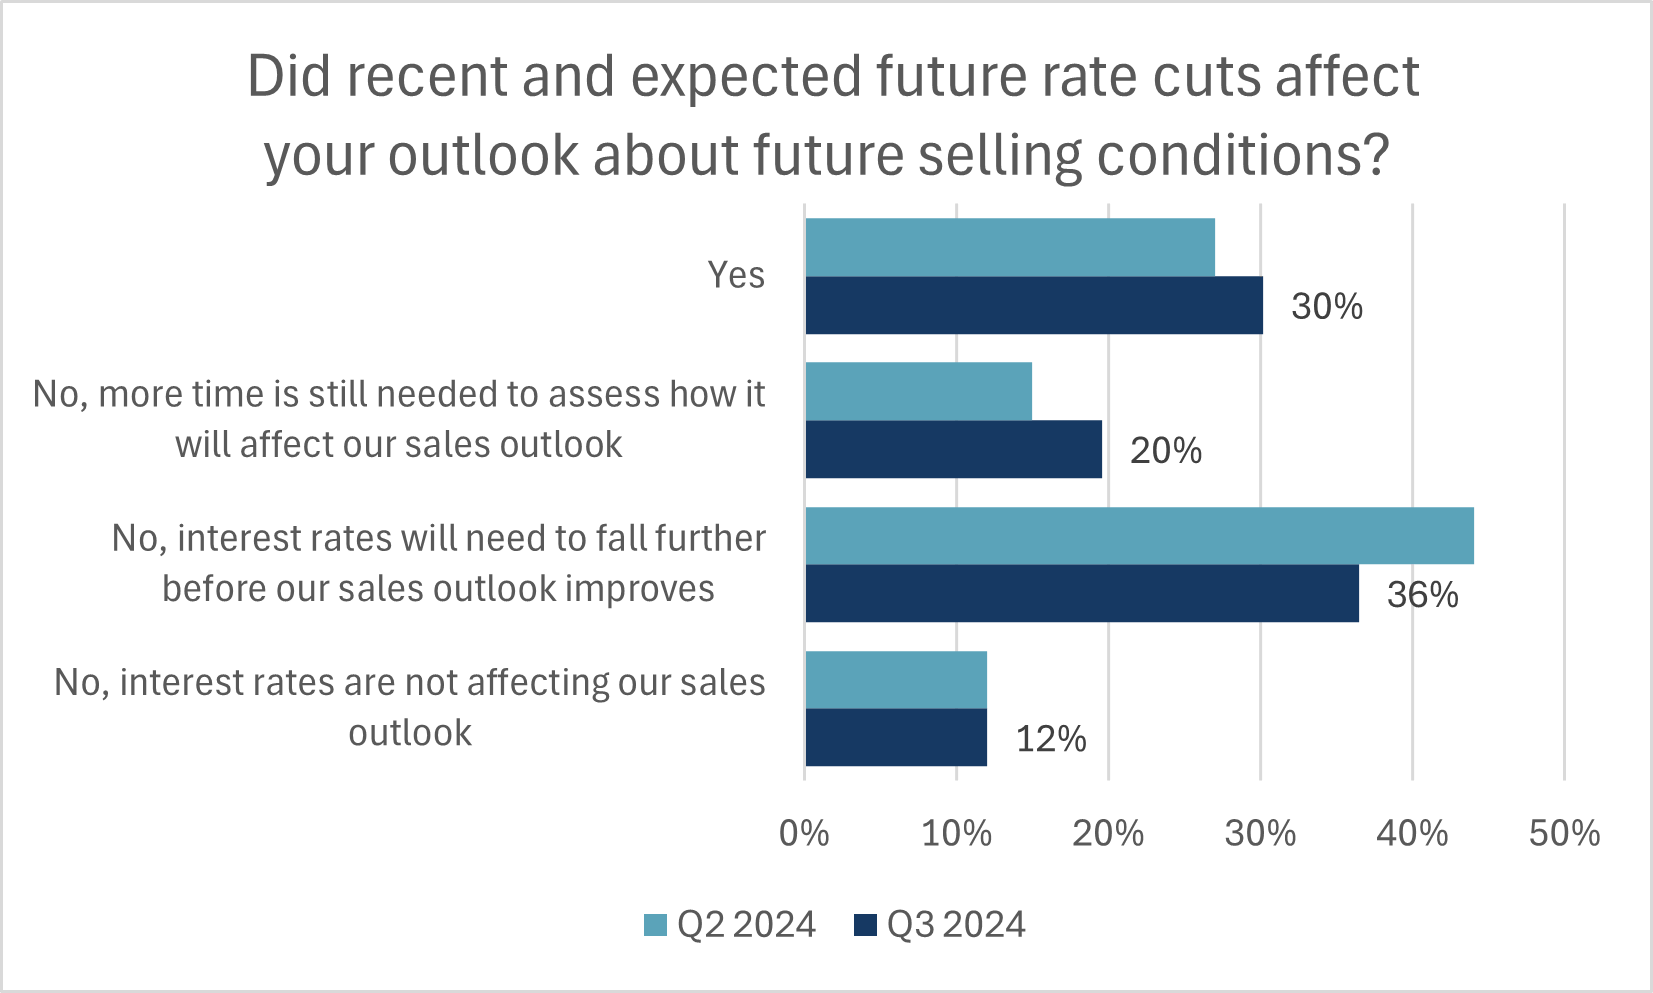
- The Bank of Canada cut its policy rate two additional times in the third quarter. Builders were again asked if these cuts, along with expectations for future rate cuts, materially influenced their view on future sales conditions. 30 percent said it did. But as with the previous quarter, the largest share of builders, at 36%, stated that it did not and that rate will need to fall further, with another 20 percent saying more time is needed to assess impactds on their outlook. Given that most mortgage originations remain fixed-rate, which are slower to adjust, and that mortgage rates still face issues with the stress test, it is not surprising that the marjority of builders remain dubious.
- While sales conditions across the country remains weak, regional variations in sales strength have emerged. This has reduced the proportion of builders reporting that the current interest rate environment is hampering their operations relative to a year ago, but is regional – regions with better affordability are seeing a greater impact of lower interest rates, while more expensive markets are finding slightly lower interest rates are insufficient to create a turnaround. Overall, the majority of builders continue to state that the rates for builders and homebuyers are reducing their quantity of starts. Note that this question does not measure the magnitude of the interest rate impact on starts.
- Half of builders continue to expect to have fewer starts this year compared to 2023. Of particular concern is that this group contains many small and medium sized builders who report they will have far fewer starts this year. On average this group expects to have 52% fewer starts relative to 2023. 36% of builders expect starts to be about the same, while on 15% expect higher starts. Some builders did comment that they are hopeful for a better 2025 spring selling season, which will lead to starts in late 2025 or the following year.
- While credit conditions have broadly eased with policy rate cuts, it is less clear for builders accessing loans for construction. 40% said it is more difficult to work with lenders in 2024, a function of other tightening in lending practice. This is attributable to difficulties in meeting lenders’ pre-construction sales requirements, changes to CHMC multi-family insurance offerings, and appraisers more closely monitoring values of the project. Several builders that were not sure about credit access conditions stated because they have not needed funding this year.

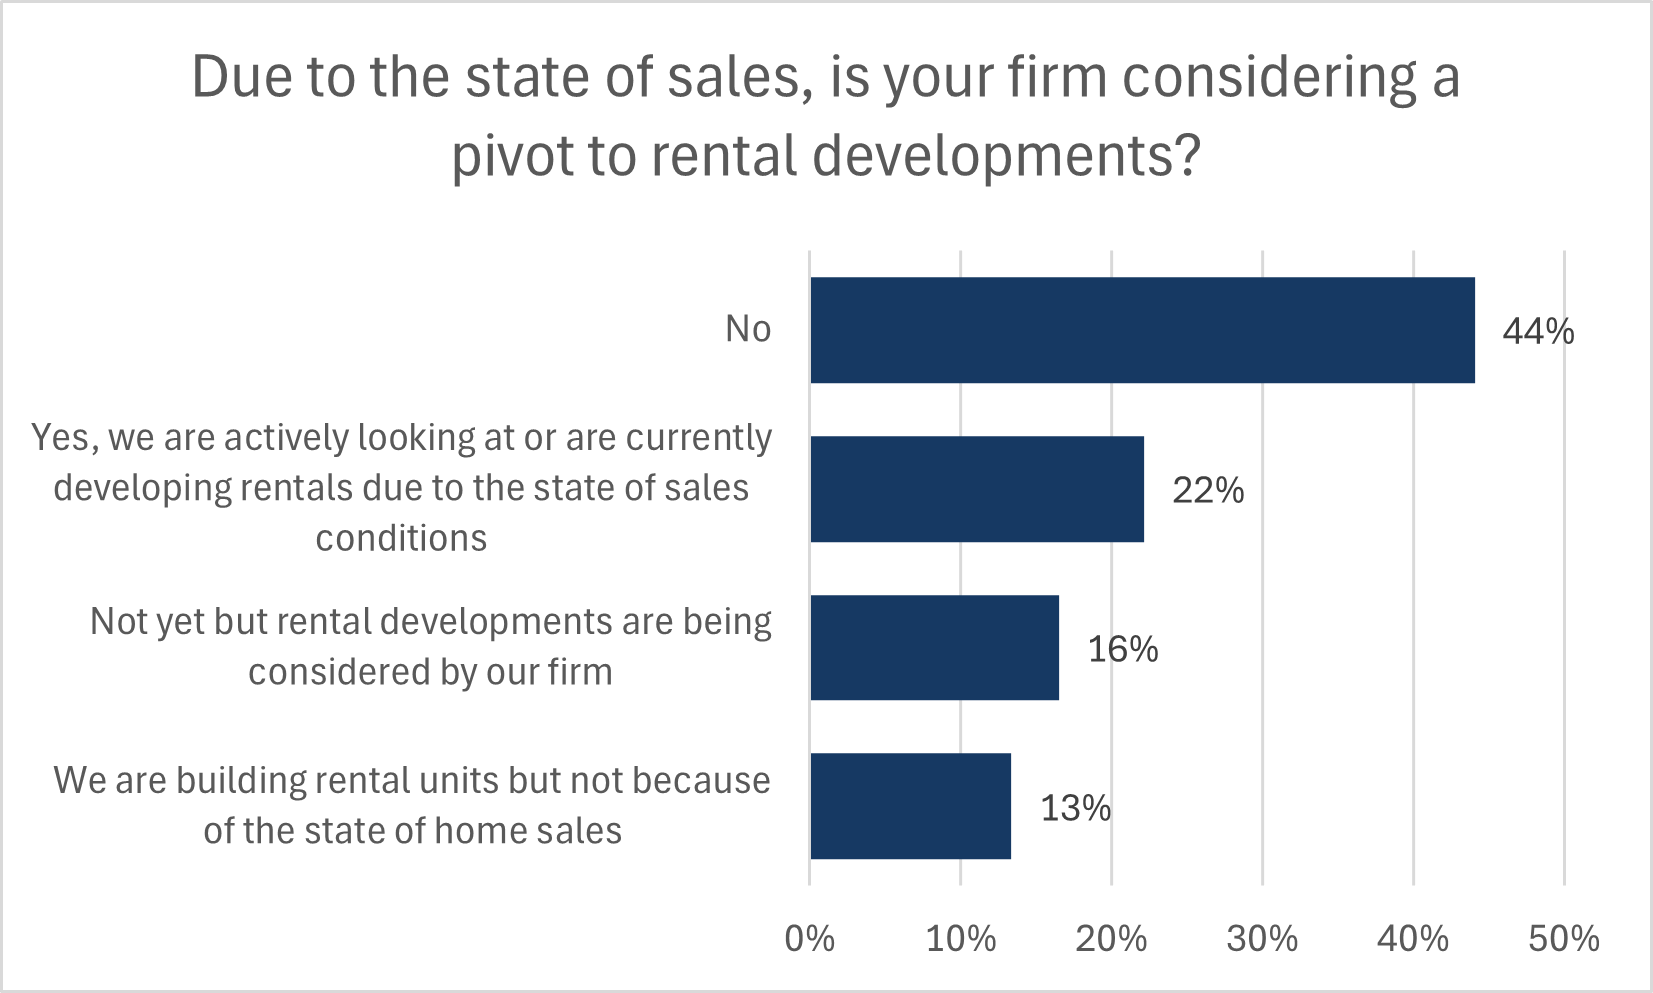
- The extended period of weak sales, along with year-old enhanced rental GST rebate incentive, builders were asked if they are or are considering pivoting to constructing rental units. 22% of builders said that the state of new home sales has led them to develop or actively consider developing rental units. A further 16% stated that this is informally under consideration. CHBA will monitor this trend in future HMI surveys.
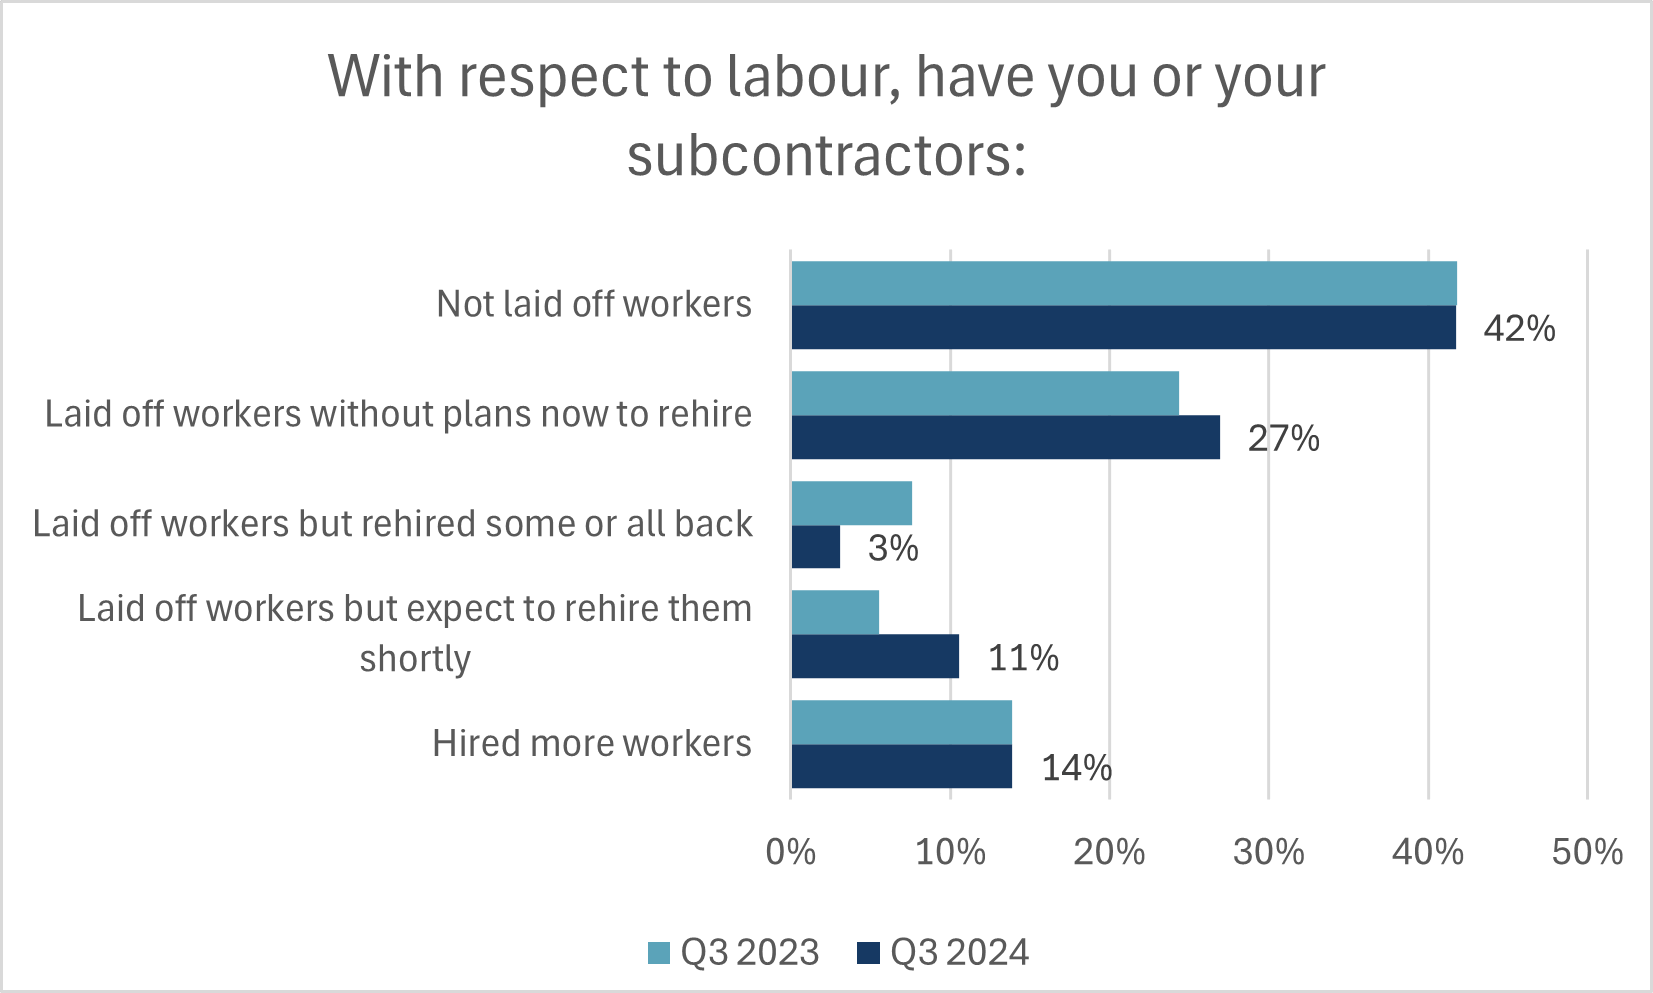
- While past surveys have illustrated that trades access and prices have stabilized relative to their challenges in recent years, the underlying labour shortage in residential construction remains. 42% of builders state they have not laid off workers, partly due to the difficulty in finding a replacement at a time when local market conditions improve. The results of this question were in line with findings from the third quarter survey in 2023.
- The average increase of non-lumber materials cost relative to this time last year, as reported by surveyed builders, added an additional $35,270 to the cost of a square foot detached home. Factory gate softwood lumber prices have declined over 2% from a year ago, but this still leaves the lumber cost for the same 2,400 square foot home at over $26,000 more than it was pre-pandemic. Normal rates of inflation for building materials continues to compound the accelerated cost increases from the years prior, further eroding affordability.
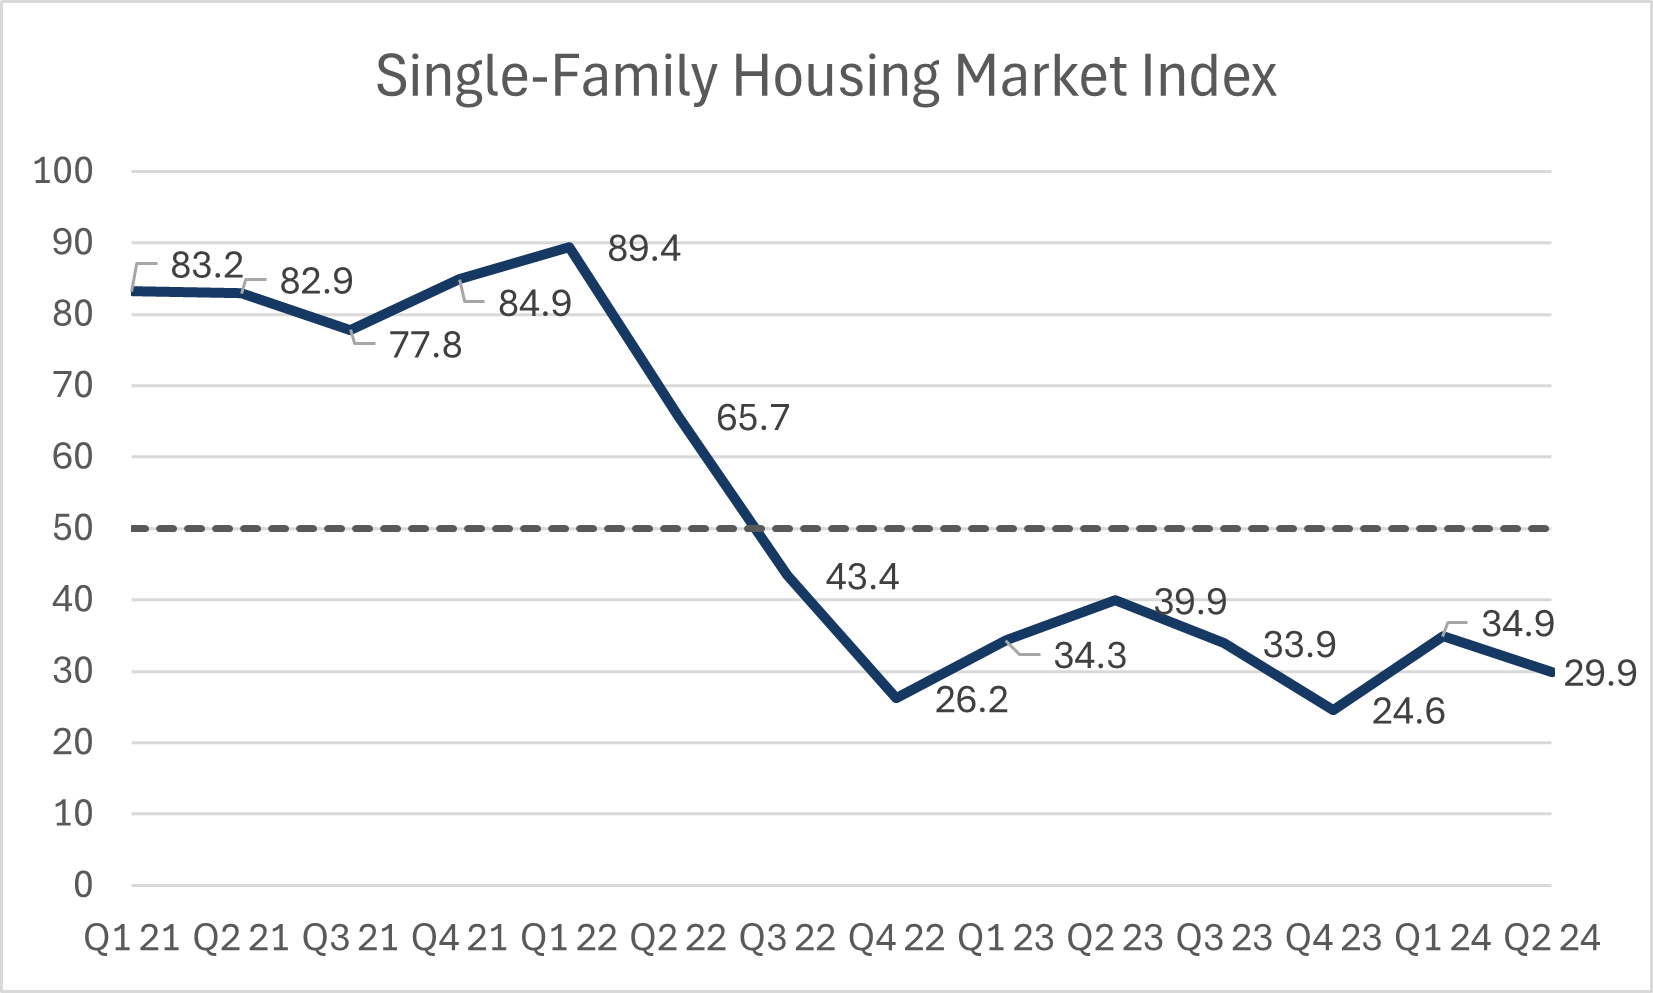
- The CHBA Single-Family Housing Market Index (HMI) continued to reflect builders’ broadly pessimistic views on new home selling conditions, registering a score of 29.9 in the second quarter of 2024. This score is 5 points lower than in the first quarter of 2024 and 10 points lower than in same quarter of 2023. This latest reading is close to the record low of 24.6, in the fourth quarter of 2023. By comparison, the record high was at 89.4 in Q1 2022, when interest rates were still extremely low and before the rate hikes began.
- Since the final quarter of 2022, there are different regional trends in selling conditions sentiment that have emerged. Sentiment held by Ontario and BC have continued their downward trajectory and the single-family HMI in both provinces hit their lowest level ever in Q2 2024 (11.6 in Ontario and 17.8 in BC).
- Over the same 18-month period, sentiment across the aggregated prairie provinces has trended up and breached the neutral sentiment mark of 50 for the first time since Q2 2022. Meanwhile, builder sentiment in the Atlantic provinces has held steady and is modestly positive.
- In the US, the NAHB/Well Fargo single family HMI averaged a score of 46.3 in the second quarter. This sentiment was also down from both a quarter ago and a year ago, albeit not as much as the declines seen in Canada. This is reflected in healthier housing starts in the US versus Canada.
- The present-sales sub-index fell once again, as the majority of builders rated conditions as Poor. With costs continuing to pressure selling prices, the builders experienced another challenging spring sales season. In Ontario, there were no builders that characterized current sales as Good.
- Builders continue to hope for more normal conditions in the future, based on the expected future selling conditions sub-index. 48% of builders rated future selling conditions as Fair. This proportion has roughly held steady over the past year, and points to expectations of falling interest rates and hope that policy changes will come into effect to help conditions.
- Single-family sales traffic remained the weakest sub-index, with 60% of builders rating traffic sales and/or inquiries Low or Very Low. This suggests builders experienced an even slower important spring season relative to the same time last year.

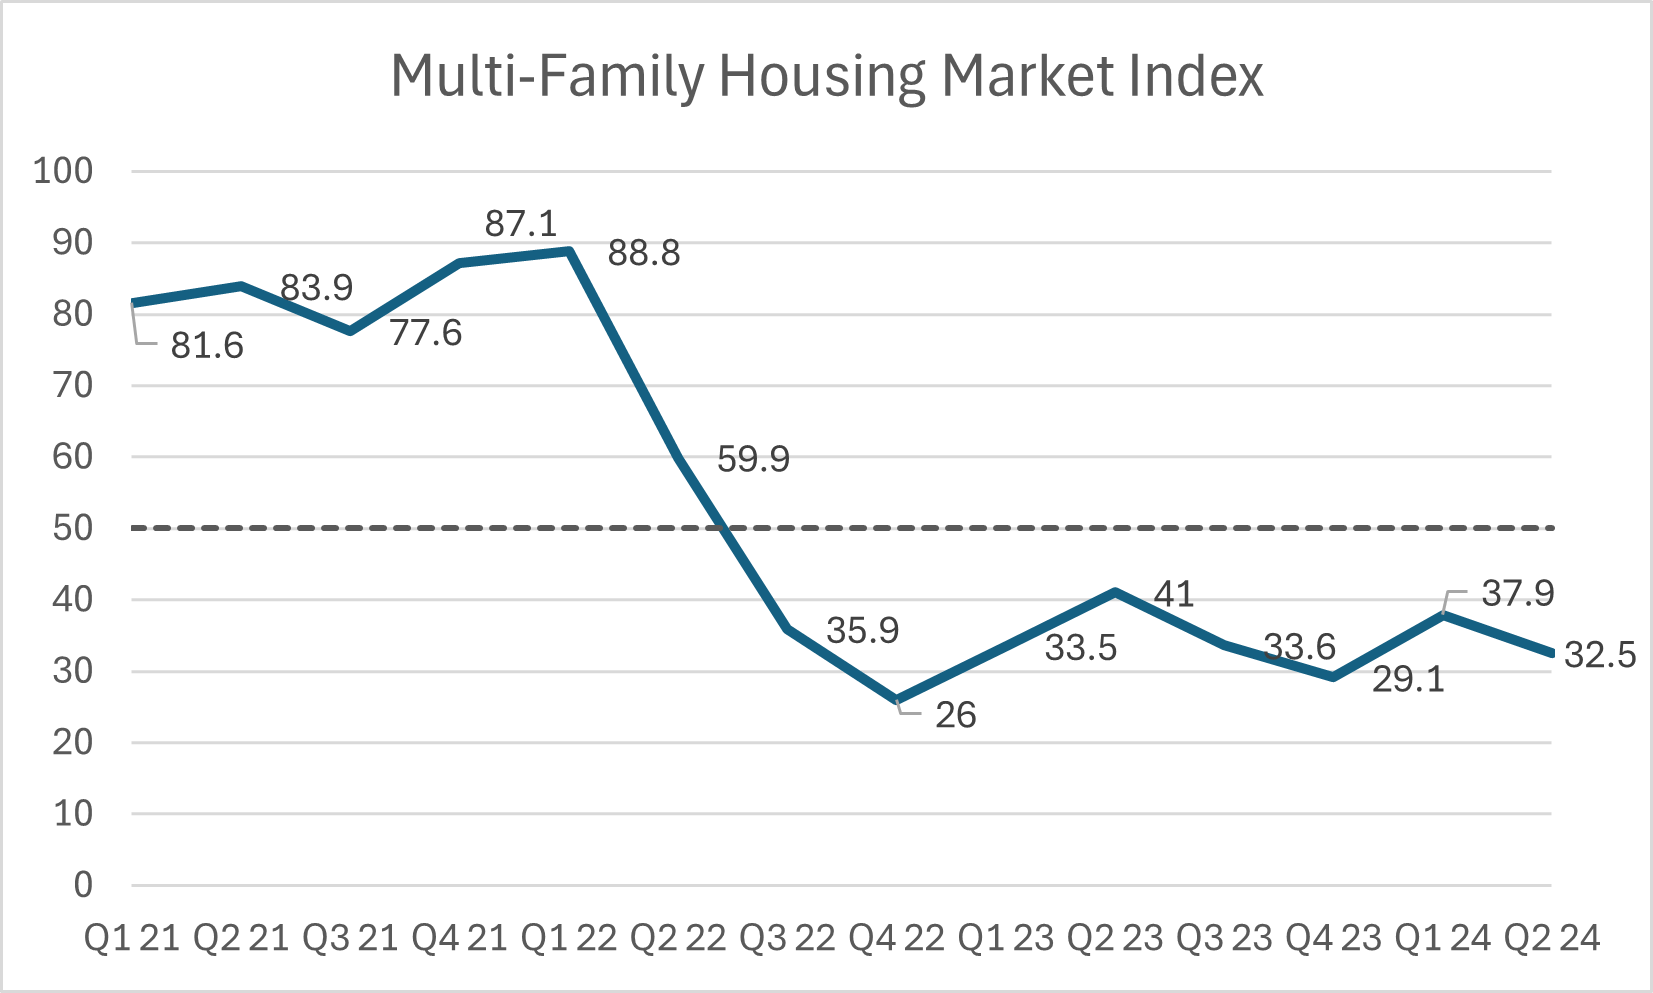
- The second quarter multi-family housing market index was 32.5 – firmly downbeat selling conditions. The index fell 5.4 points relative to the previous quarter and 8.5 points relative to the same quarter a year ago.
- Regional results were similar to the findings of the single-family index. Overall sentiment is at survey record lows in Ontario (11.6) and British Columbia (32.5), with the overall index lifted by sentiment in the prairie provinces, which has remained above 50 for five consecutive quarters.
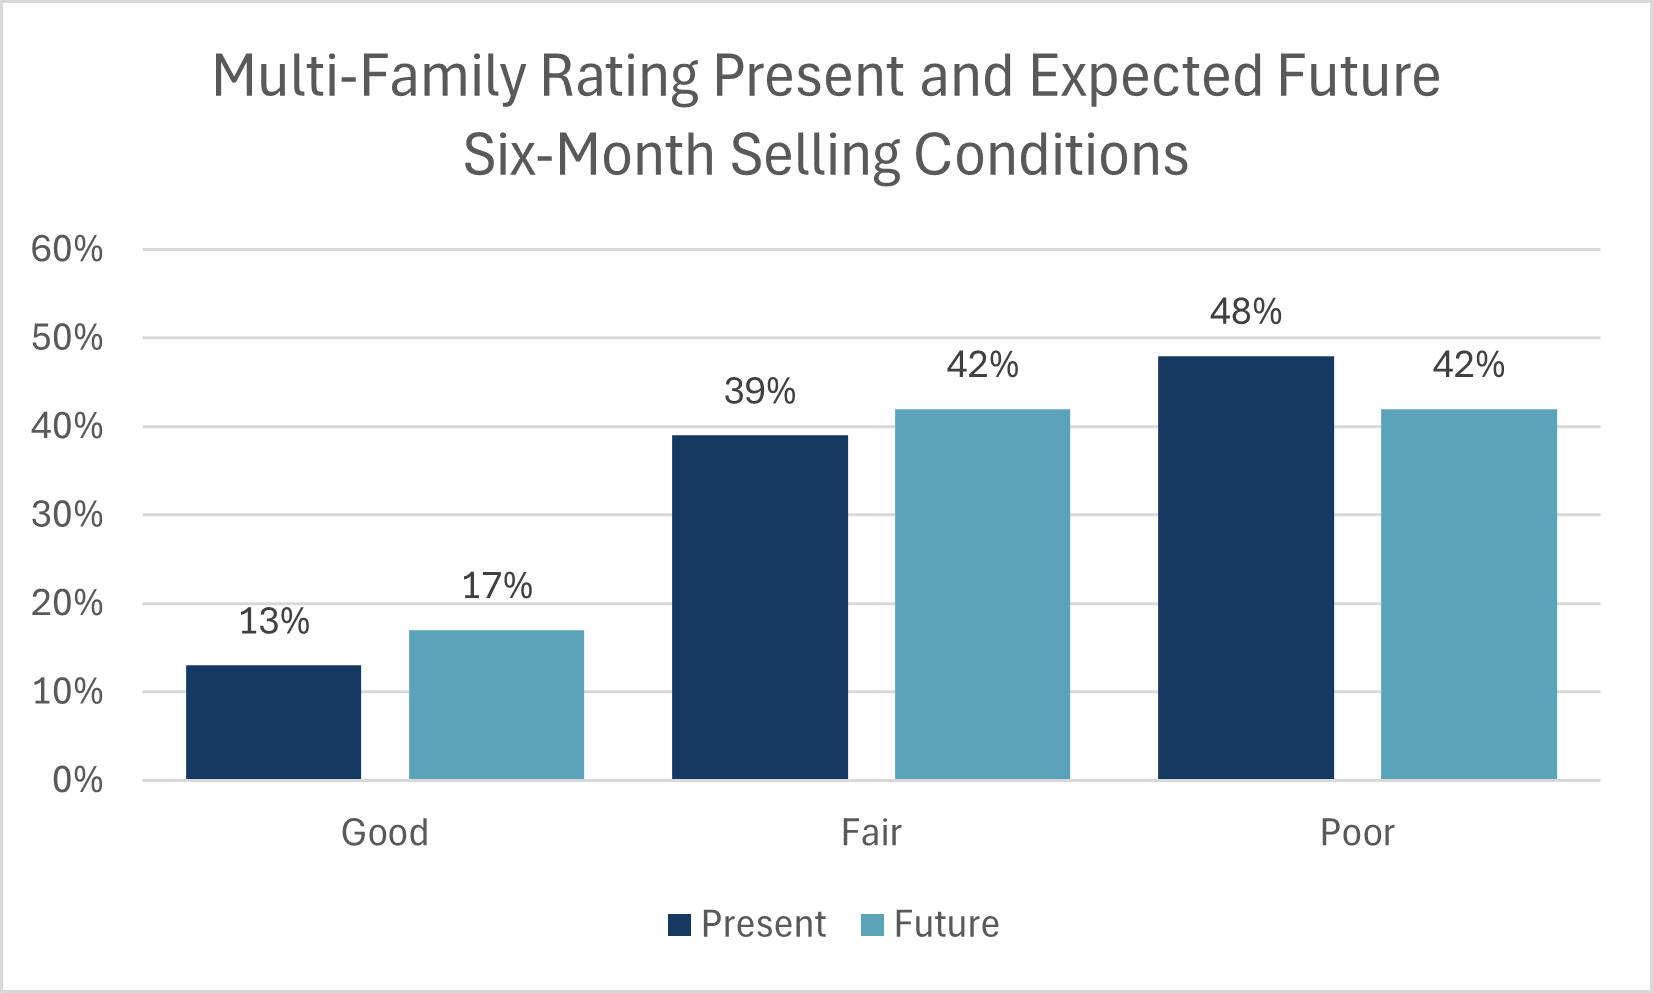
- The present sales sub-index remained pessimistic, with 48% of builders rating it as Poor. This proportion was a 10-percentage-point increase over both the last quarter and the result from the Q2 2023 survey, underscoring the slow sales conditions. Only 13% of builders gave present conditions a rating of Good, and this small proportion has held steady for four consecutive quarters.
- The expectations for future sales sub-index showed that 42% of builders expect Fair conditions, and an equal proportion rated their outlook as Poor. Notably, the proportion rating a poor outlook rose by 24 percentage points over the previous quarter.
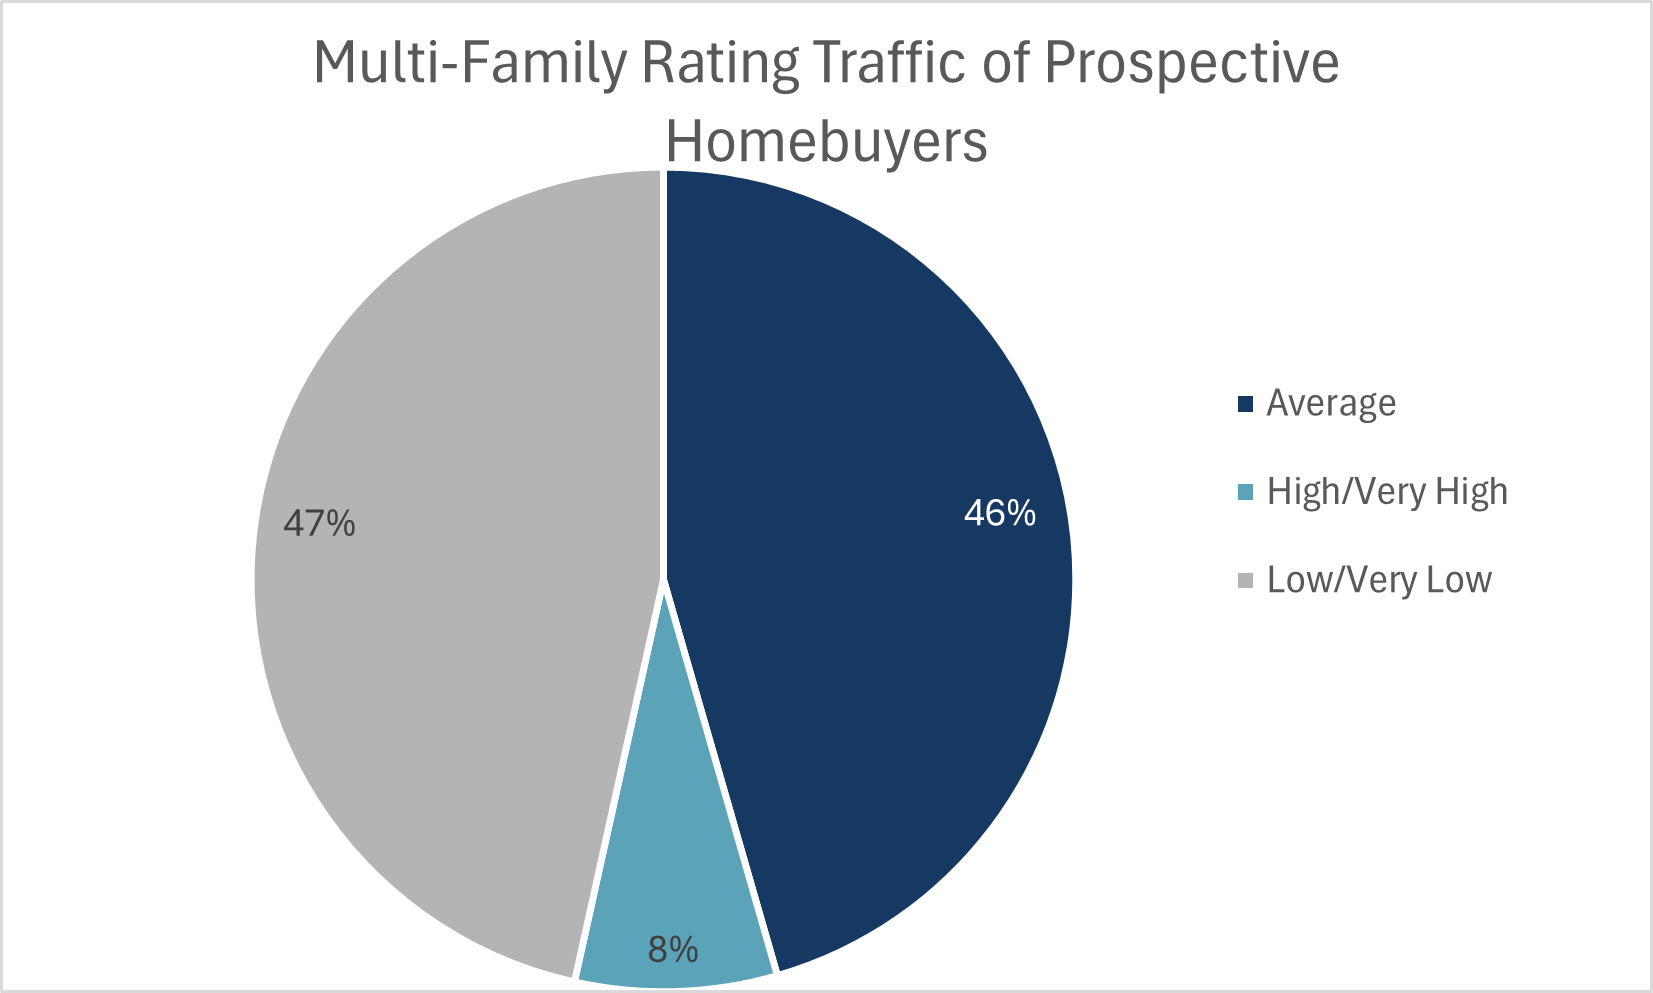
- The sales office traffic sub-index was the lowest of the three. Only single-digit proportions of builders reported traffic levels of High or Very High, which has remained consistent over the past year.
The results from these questions allow CHBA to better understand what is driving change in builder sentiment as well as monitor current industry issues.
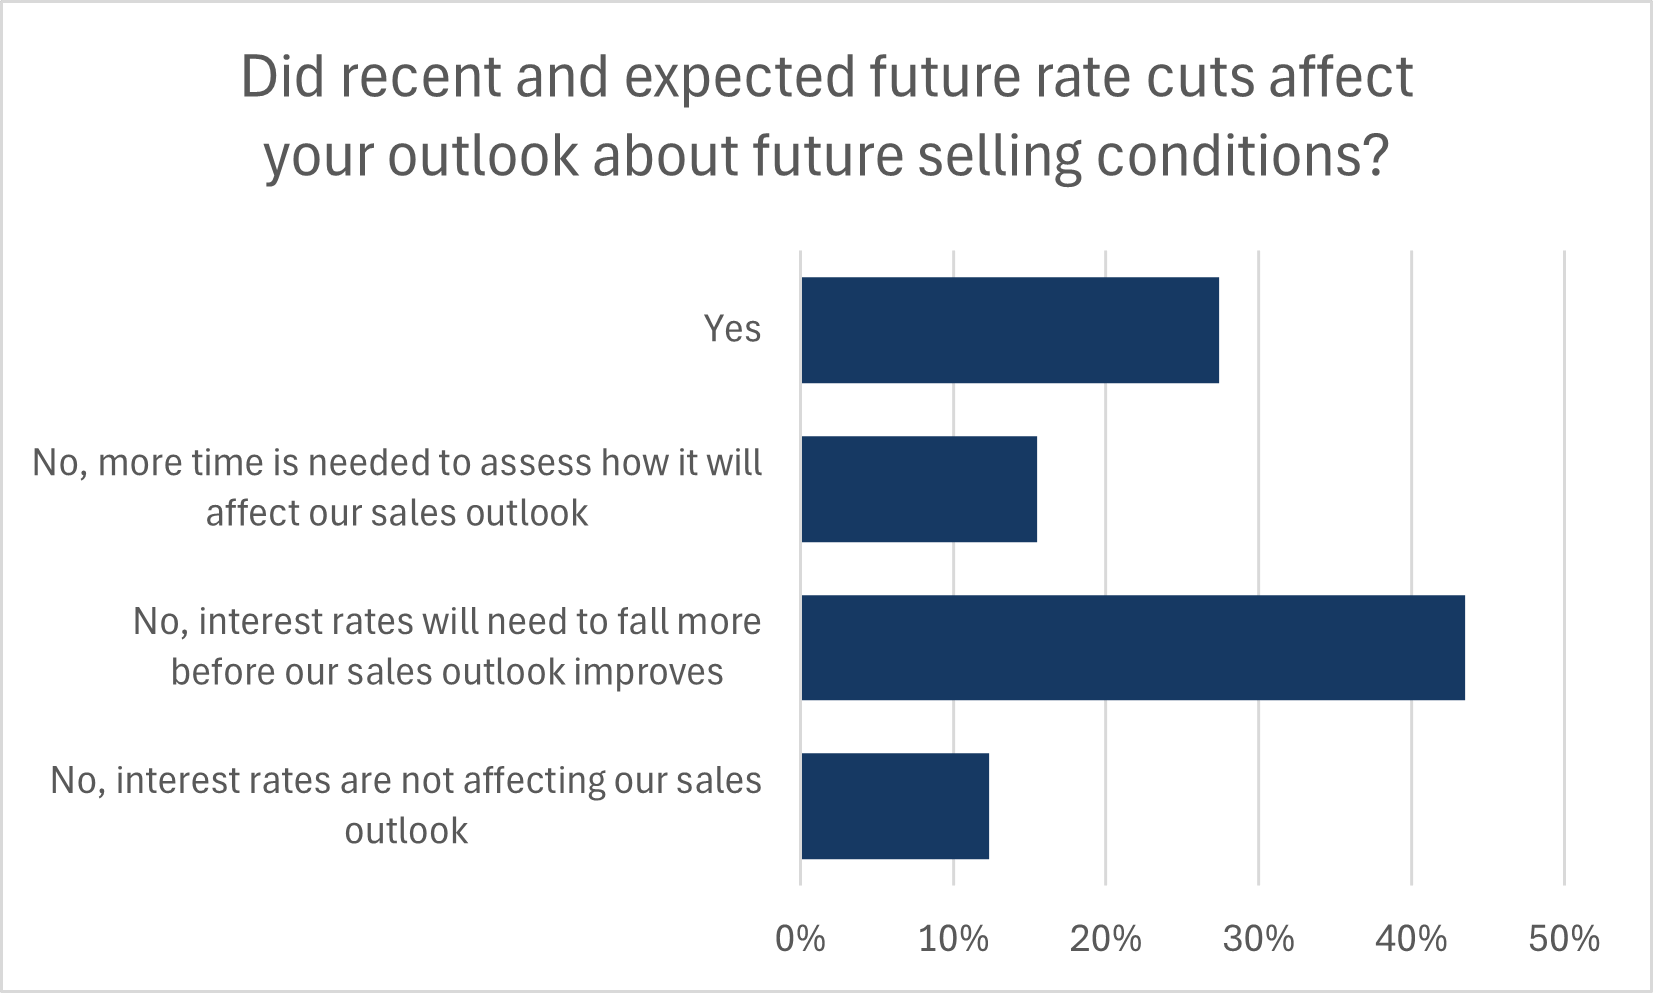
- Builders were asked if June’s 25-basis point lowering of the Bank of Canada’s policy rate affected their answer regarding their outlook on future sales over the next six months. 44% of builders said that rates will need to fall further before they adjust how they rate their outlook on sales conditions over the next six months. 27% stated that the cut did affect their outlook, likely related to how it increased confidence if there are additional rate reductions in the months ahead.
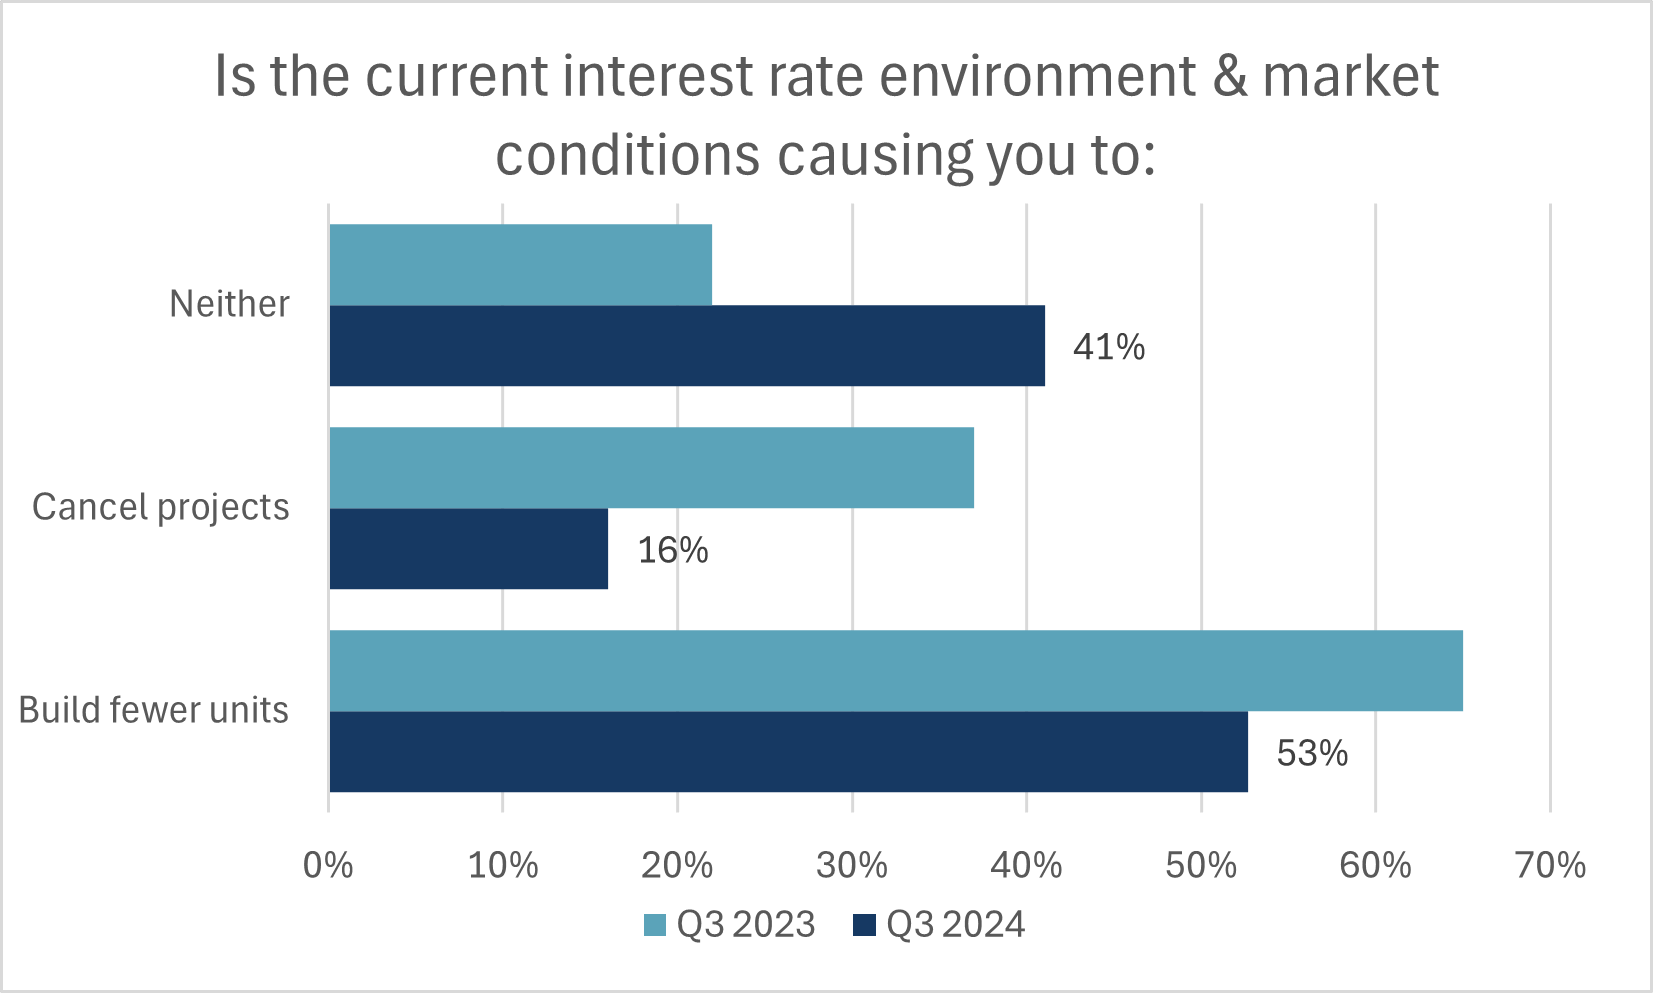
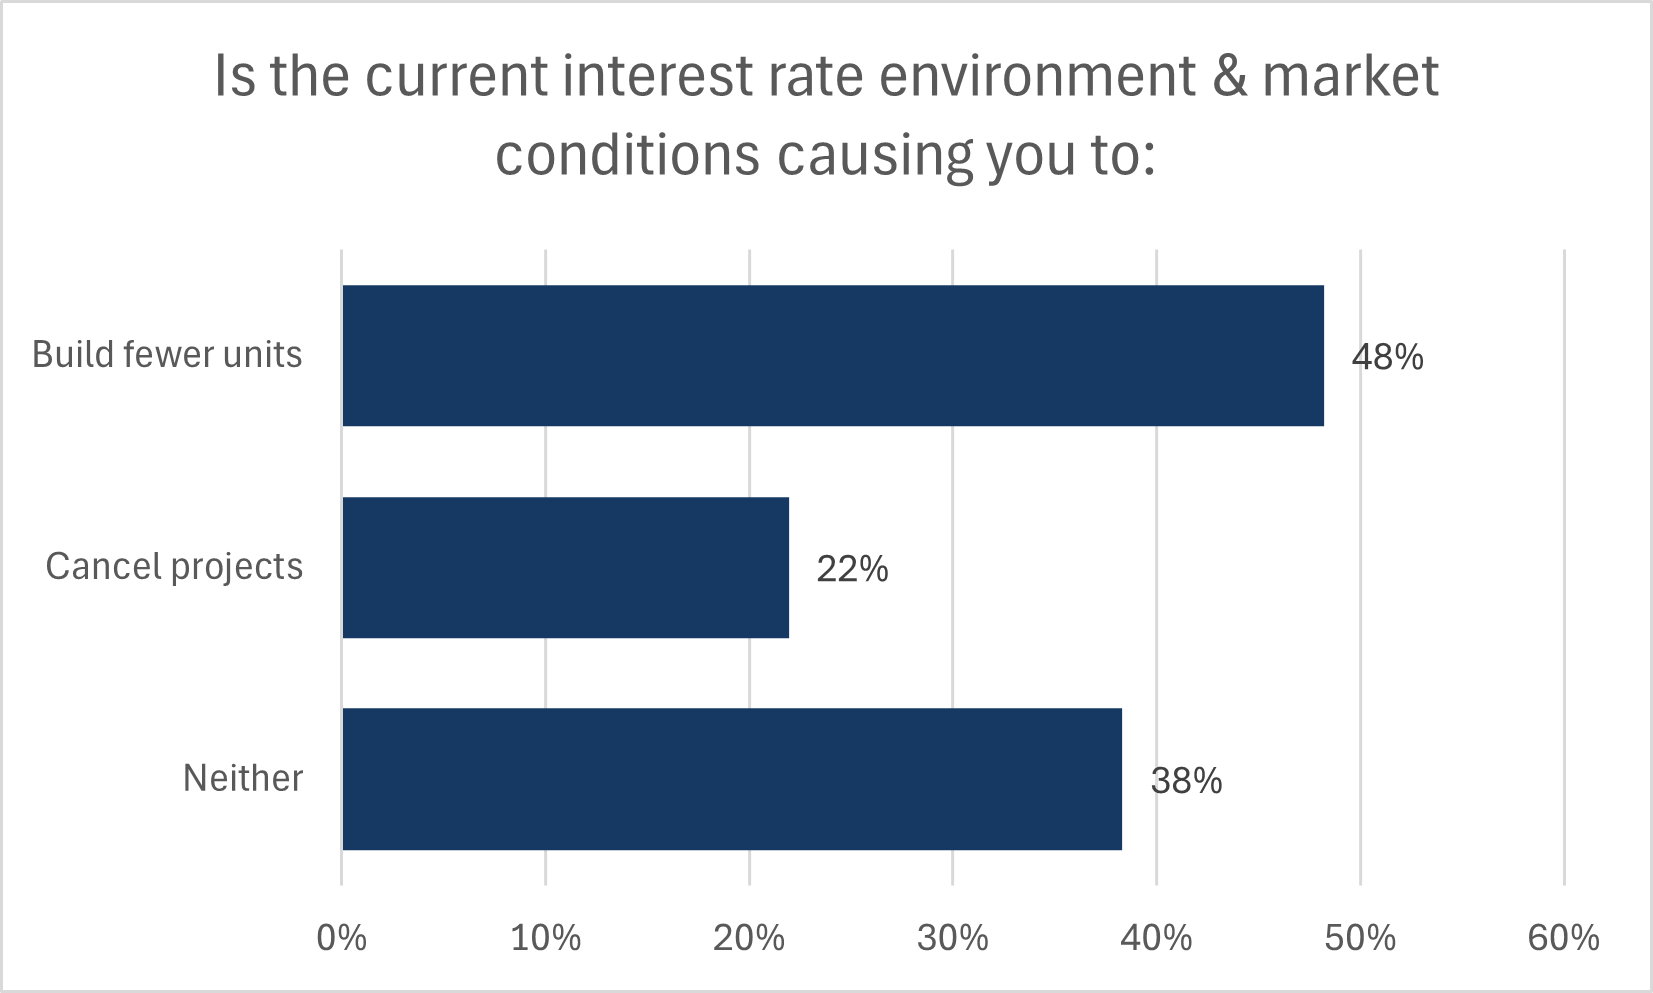
- With the majority of builders believing that further rate reductions and/or more time is needed to normalize the level of well qualified demand, builders also reported that their construction activity continues to be hampered. 48% stated that they are building fewer units than they otherwise would have as a result of demand reduction attributable to challenges with mortgage qualification. 22% have stated that the lack of sales have led to the cancellation of projects.
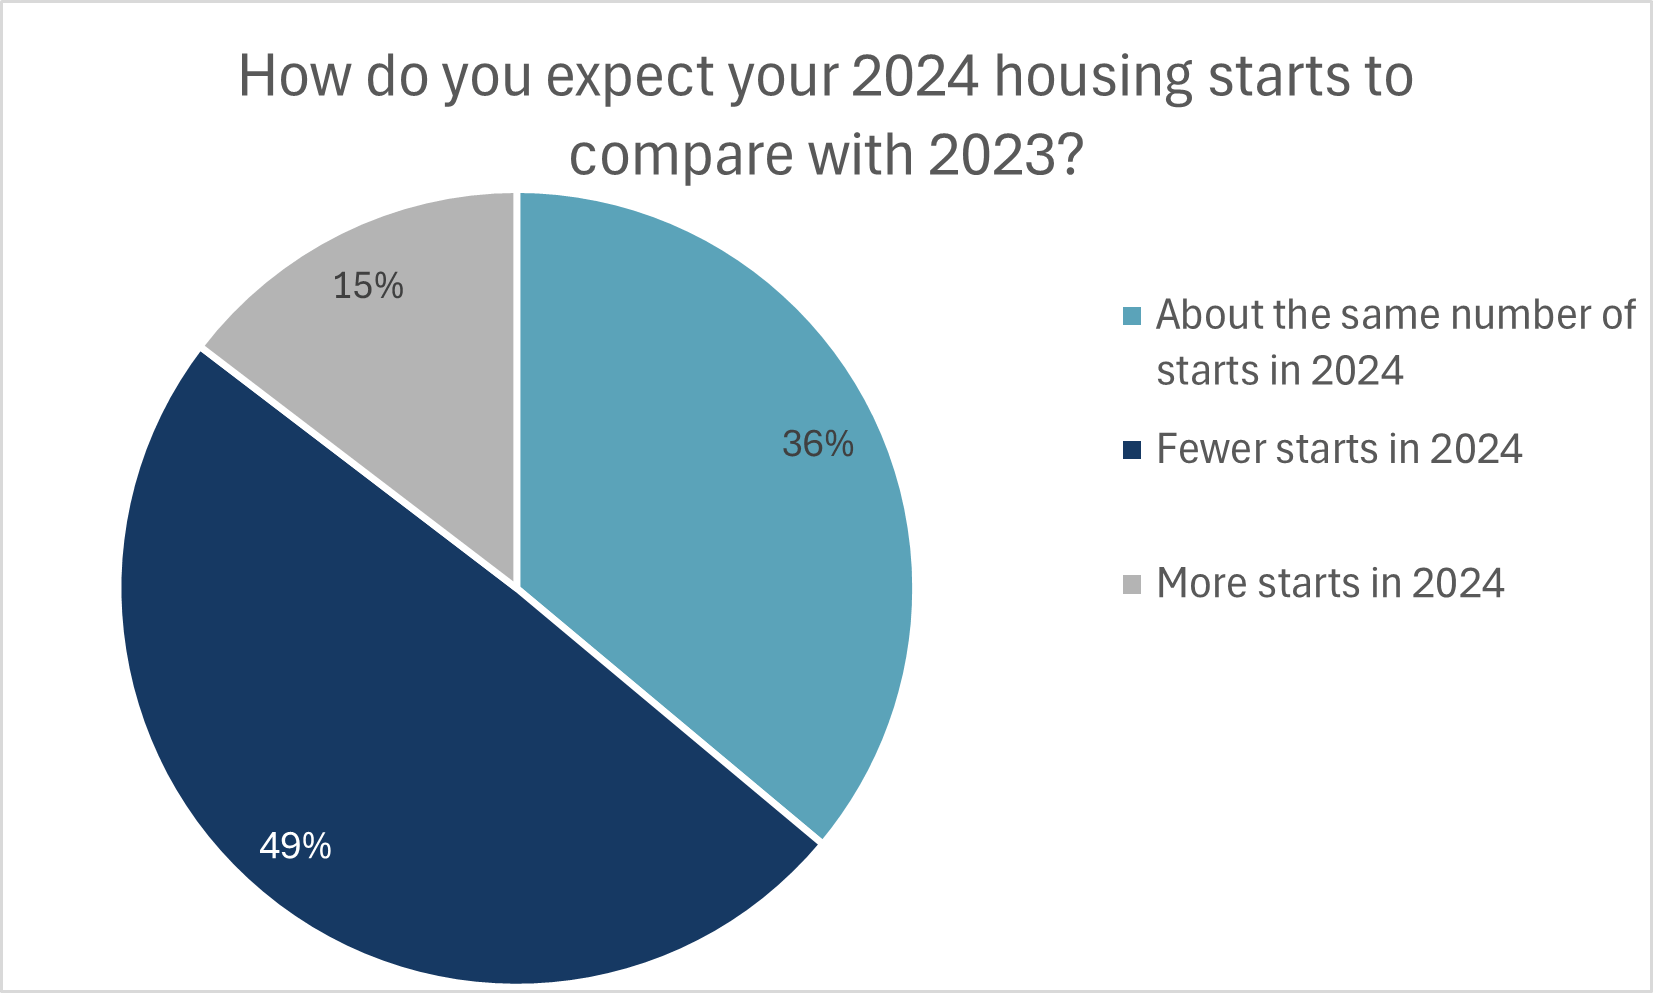
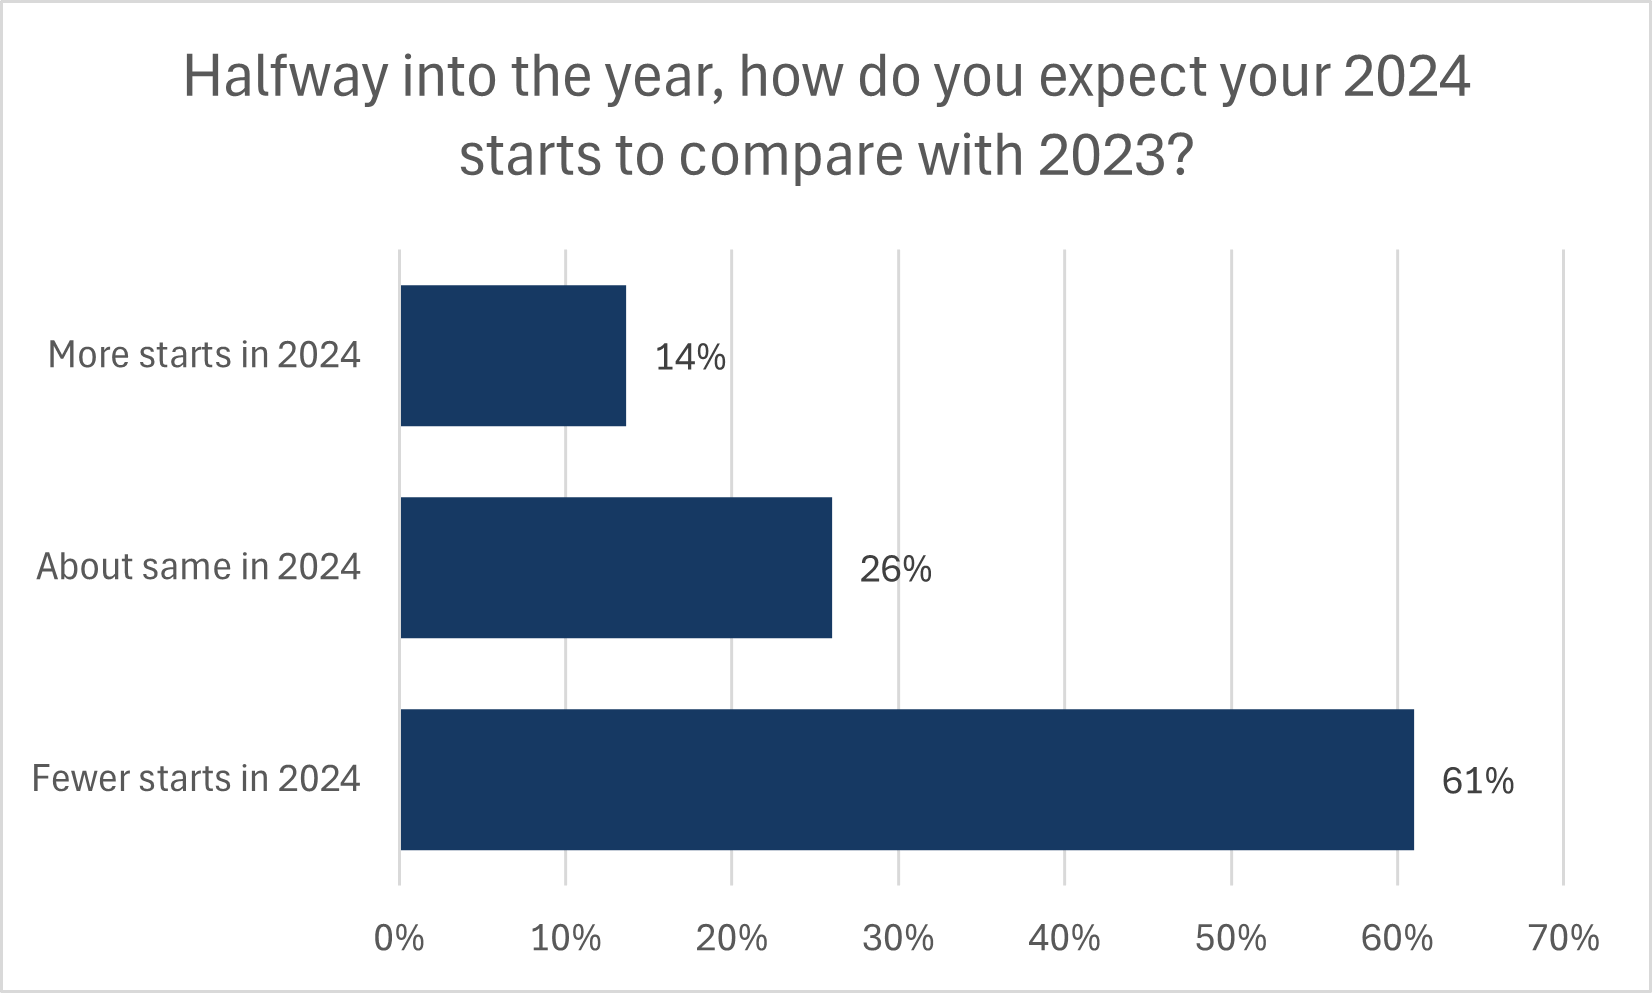
- Builders were again asked how they expect 2024 housing starts will compare against their starts in 2023. 61% of respondents expect to have fewer starts. This group of builders on average believed that their number of starts will fall 50% relative to 2023. Several small- and medium-sized builders in BC and Ontario believe that their starts will fall by 80 percent or more. Only 26% of builders felt they would maintain a similar level of starts as last year.
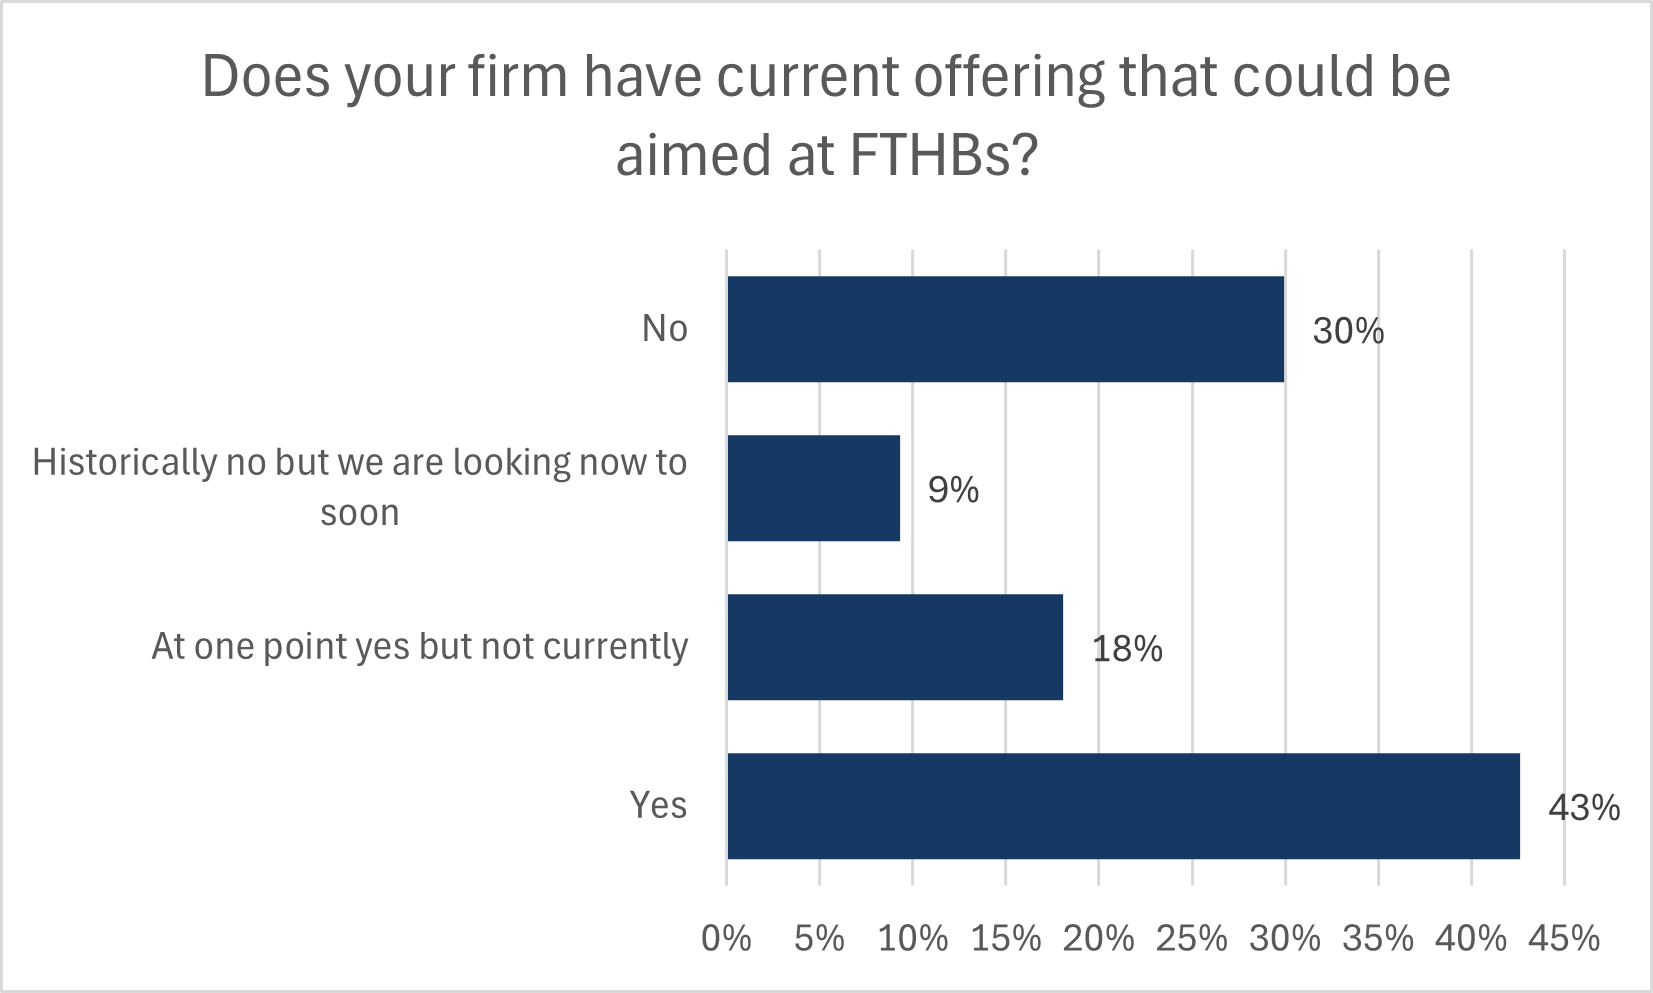
- The Canada Housing Plan, within the Federal Budget 2024, announced a lengthening of insured mortgage maximum amortizations from 25- to 30-years for new homes purchased by first-time home buyers (FTHB)—beginning August 1st. This move aims to support the creation of new supply at the entry-level segment of the market. 43% of builders state that they produce homes that could be aimed at first-time buyers. Given affordability and the cost of construction, 30% stated they do not operate in this segment and 18% stated they used to but currently do not.
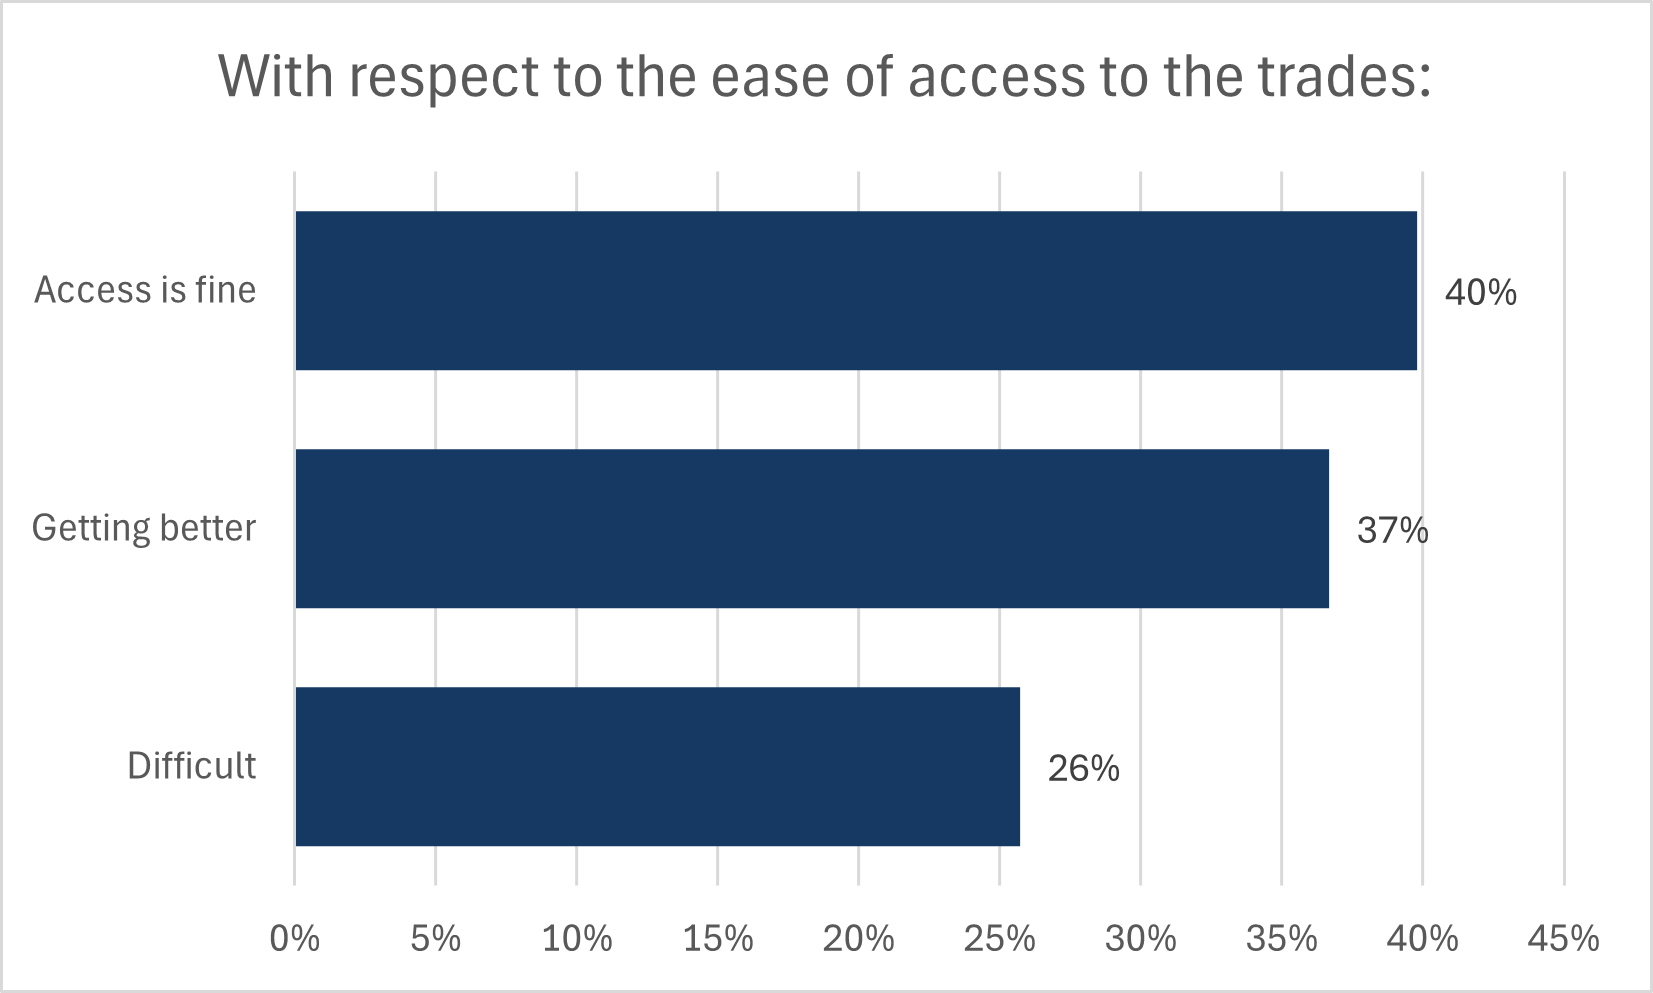
- Based on the extended period of poor sales, pressure on trades access has lowered. 40% of builders characterized trades access as Fine and a further 37% said that access was getting better. The 26% of builders that felt trades access was difficult was down from the 39% that gave this rating a year ago. It is important to note that the underlying shortage in Canada’s construction labour force has not changed and is only muted because of the slowdown in construction; this issue still requires comprehensive policy reform to increase capacity to build once the market begins to turn around.
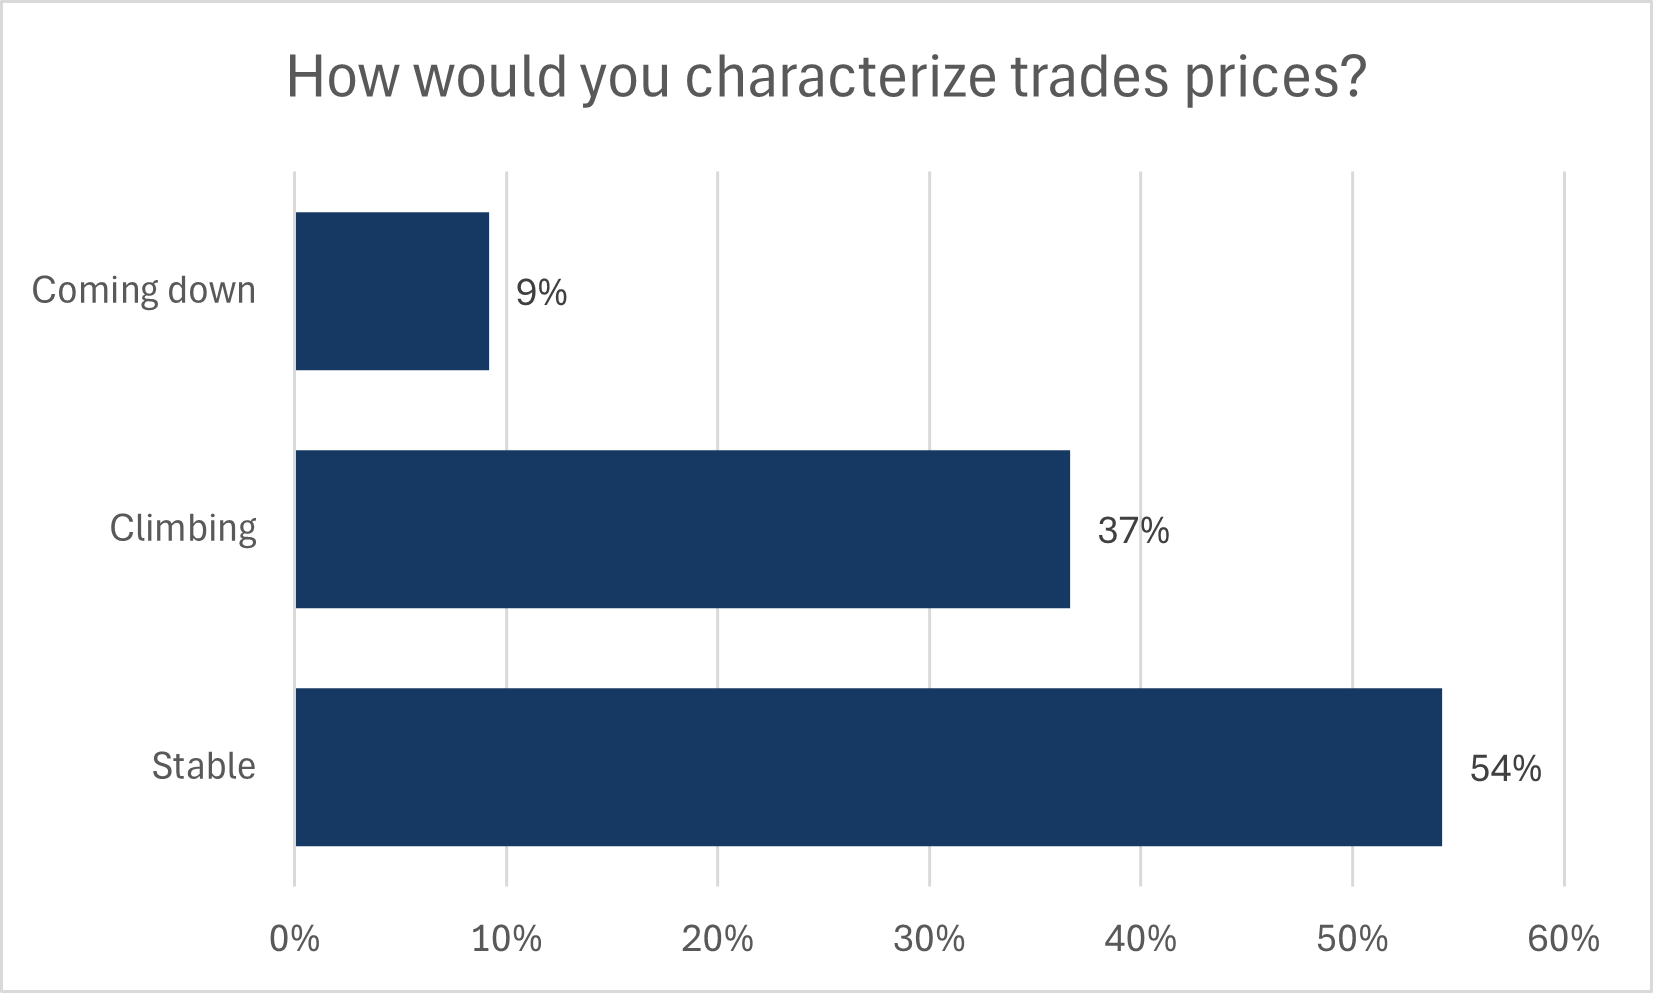
- While trades access is easing, the price of trades is continuing to rise. 37% stated that trades prices are climbing while just 9% felt they have come down. This comes after a period of rapid increase in prices, which have now settled as the new normal. While the majority believed prices are stable, these new high prices are a major source of the higher construction costs builders face.
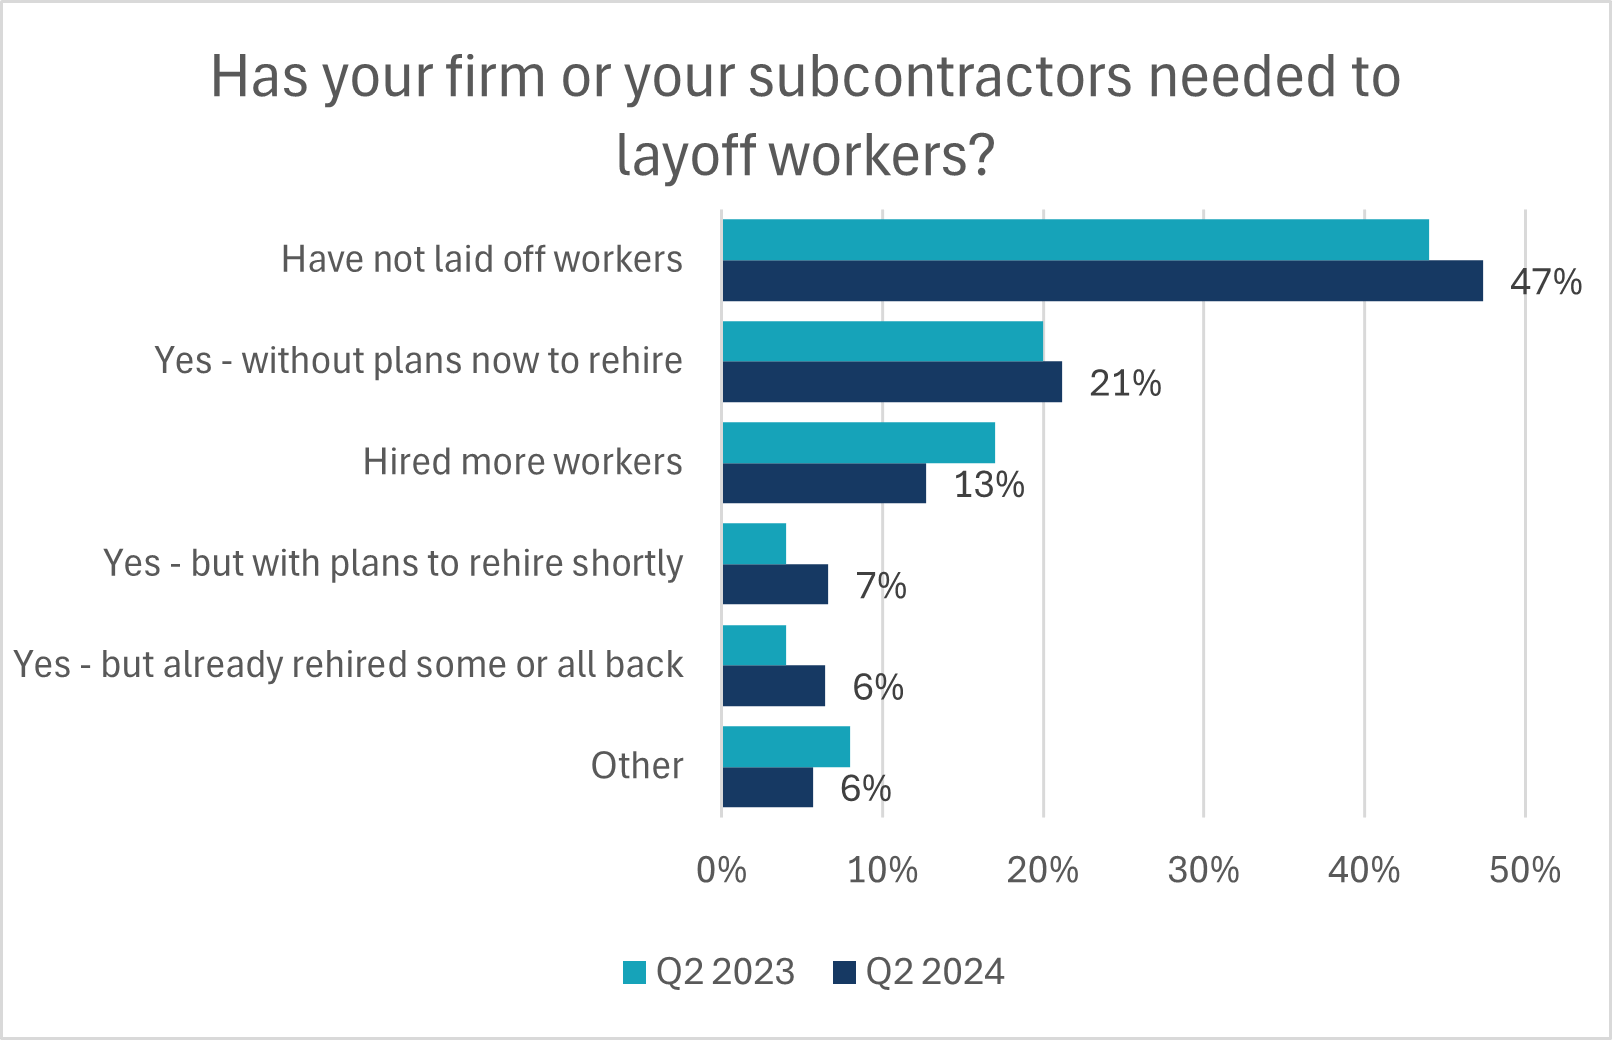
- While it may seem that trades conditions are easing under poor sales conditions, builders and the subcontractors they work with prioritize holding onto their employees. 47% reporting they have not laid off employees, reflecting the desire to retain workers even in this slow period, given the challenges of replacing them when conditions improve. The results of this question are broadly like the results of the Q2 2023 survey. In addition, average year-to-date monthly payroll employment in residential construction is largely unchanged between 2023 and 2024.
- Construction material costs also continue to mount. On average, builders estimate that their non-lumber material costs for a 2,400 square foot home have risen by just under $28,000, relative to the prices paid over the first half of 2023. Since the start of 2020, non-lumber material costs for said home will have risen by $70,000. When combined with the costs of lumber, which are also rising, inflation of material prices has added $94,000 to the cost of construction to a 2,400 square foot home compared to 4.5 years ago.
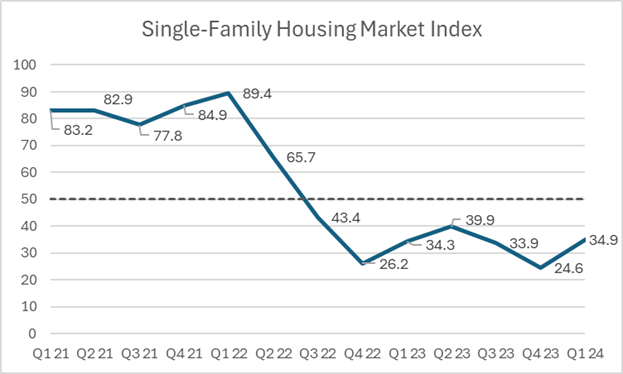
- The Q1 2024 single-family housing market index value is 34.9, 10.3 points above the record low of 24.6 in Q4 2023. This quarter’s index value is also in line with the level recorded a year ago.
- Despite the increase, it comes on the heels of a 3-year low in sentiment from the previous quarter. This means that negative sentiment, below a value of 50, has prevailed for seven consecutive quarters.
- In comparison to US single-family builders, the NAHB/Wells Fargo HMI averaged 48. This was also an improvement over sentiment in Q4 2023, and is an indication of U.S. home sales improving faster than in Canada.
- Regionally, single-family home builders in Ontario held the most downbeat views on sales once again.
- Open-ended comments from single-family builders were also in line with the responses to the HMI, with many noting extreme drops in sales.
- In a highly interest-rate-dependent market, expectations around summertime rate cut played a role in lifting sub-indices for present selling conditions, expected future selling conditions and sales office traffic levels. The rise in the current sales conditions index is likely related to well-qualified buyers forgoing some interest rate relief over the mortgage term in favour of entering the market ahead of anticipated sale price increases.
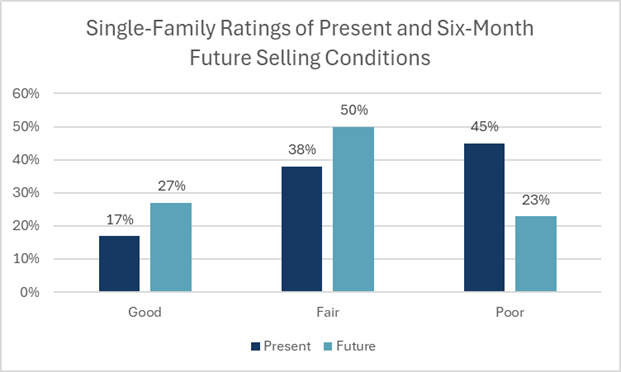
- 45% of builders rated current selling conditions as poor and contributed the most to the overall HMI remaining below 50.
- Half of builders rated their expected future selling conditions over the next six months as Fair. Again, this improvement is related to builder expectations that some additional well-qualified buyers will come off the sidelines.
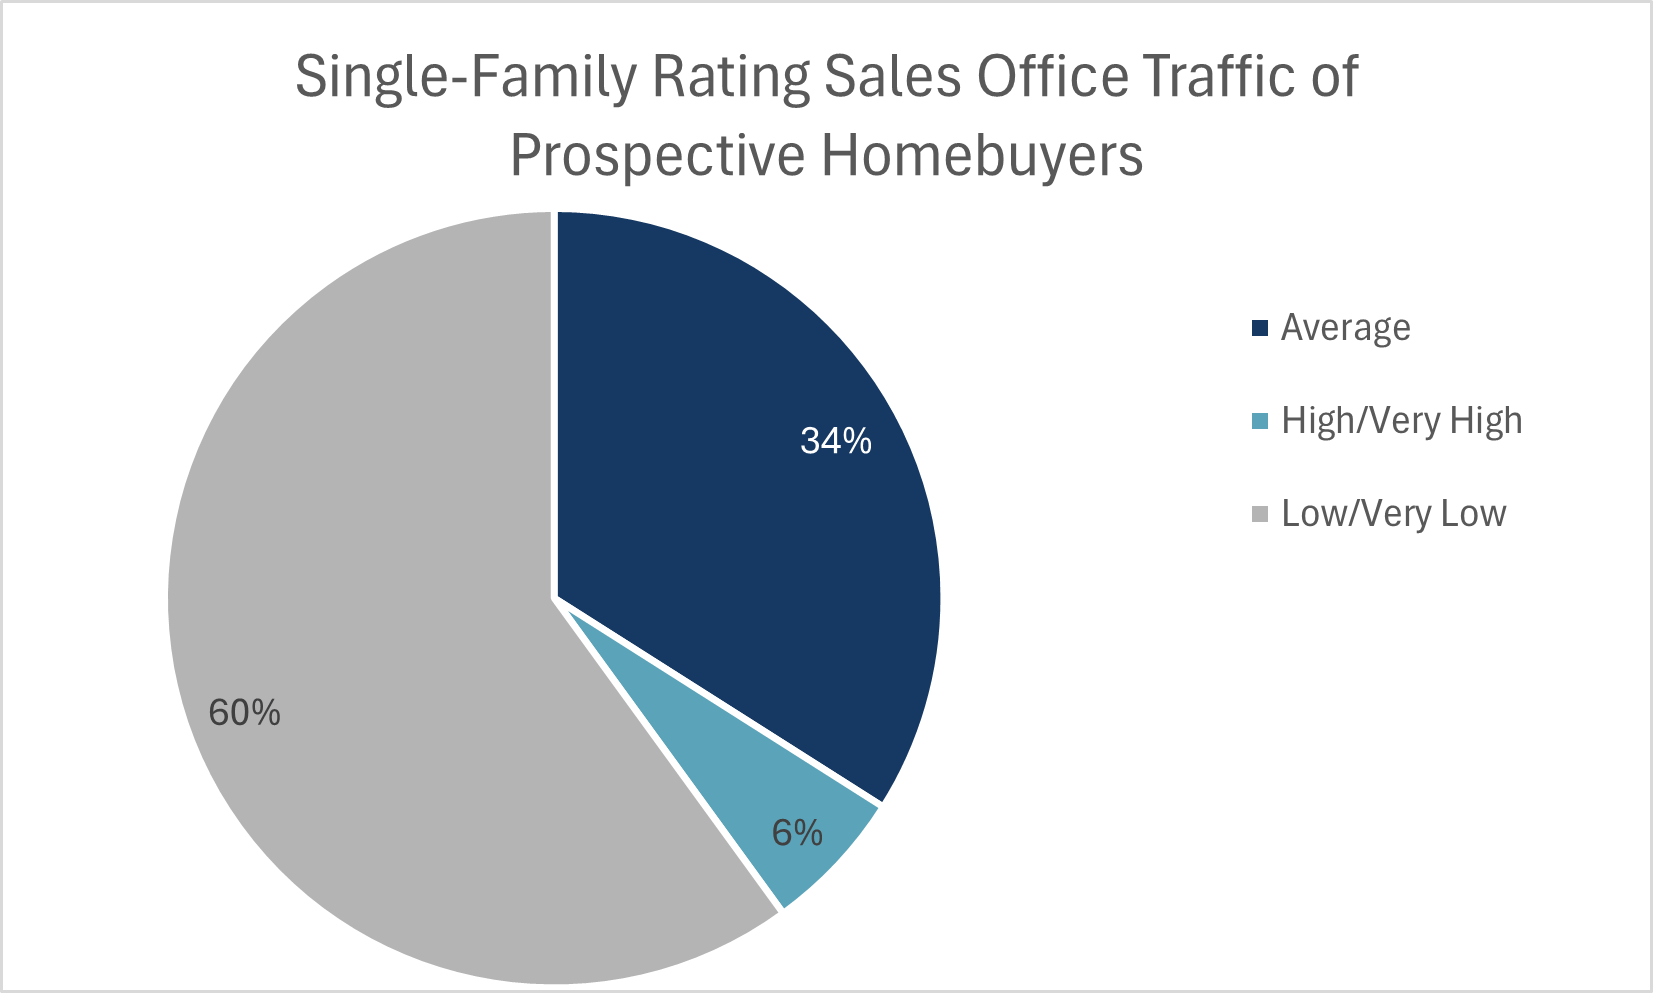
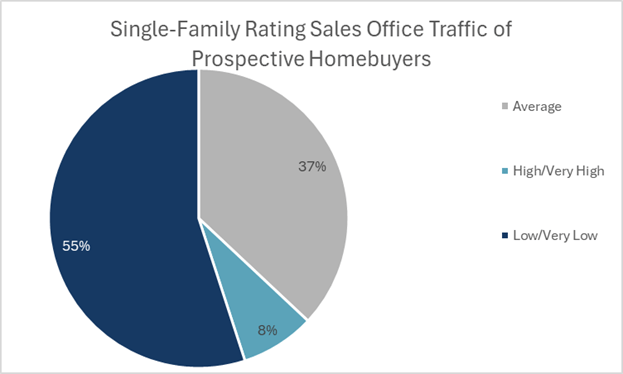
- The sales office traffic subindex was the weakest of the three HMI subindices, as 55% of builders still rated their sales office traffic as Low/Very Low and a further 38% rated traffic volumes as Average.
-
-
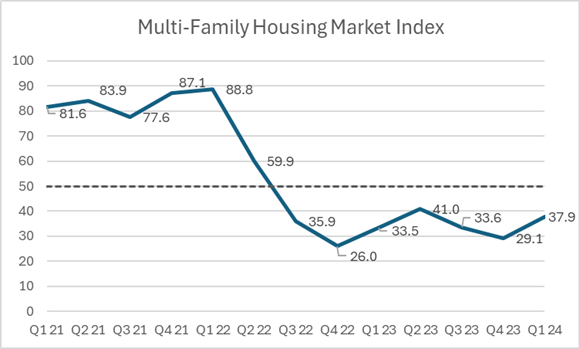
- The multi-family housing market index recorded a value of 37.9 in Q1 2024, up 8.8 points from a value of 29.1 in the previous quarter. This is modestly above the value of 33.5 recorded in Q1 2023.
- The multi-family HMI has also remained deep in pessimistic territory for seven consecutive quarters.
- Regionally, the most downbeat views continued to stem from multi-family builders in Ontario.
- 47% of multi-family builders rated current selling conditions as Fair, a material increase from the previous quarter. Yet, just 15% of respondents characterized selling conditions as good. This led to the sub-index of present selling conditions remaining well below a score of 50.
- 62% of respondents believed future selling conditions will be average. The lower cost and larger existing inventory of multi-family units relative to ground-oriented builds could help them improve sales if and when conditions improve.
- The assessment of sales office traffic was split, at roughly 45%, between rating conditions as Average volume and Low/Very Low volume.
- Despite the intense rotation towards multi-family housing starts through 2023, the survey shows that sales office traffic is still historically weak.
- Unlike the single-family builders, open-ended comments from multi-family builders were unanimously negative, largely attributed weak sales and traffic flows to buyers remaining in a wait and see mode.
-
- These questions allow CHBA to better understand what is driving change in builder sentiment and gain insights into current industry issues. The following are some of the findings from the special questions in the Q1 2024 survey:
- As the Bank of Canada’s 5.0% policy rate continues to progressively weigh on home construction activity and the broader economy, 65% of builders said that the level of interest rates have directly caused them to build fewer units than they would have otherwise, and 31% stated they have cancelled projects. These proportions are up 6 and 8 percentage points respectively from the first quarter of 2023, when the Bank’s policy rate was lifted to 4.5%.
- With the weakness in sales conditions, particularly over the second half of 2023, 54% stated that they expect their housing starts in 2024 to be below their level of starts in 2023. On average, these builders expect a decline in their starts of 41%. Just 15% of all respondents expect to have more starts in 2024.
- Builders were asked to estimate the average time between the application for a building permit and its issuance. The most common average range was 2 to 4 weeks—31% of builders. However, the second most common answer was over 10 weeks, at 22%. Out of this subset of builders, half said their average wait time can extend to six months and beyond.
- The distribution of average wait times was similar to responses in the Q2 2022 survey, with a modest reduction in the proportion of builders that are waiting more than 10 weeks. The forthcoming update to CHBA’s Municipal Benchmarking Study will provide a more robust assessment of the progress made on improving municipal processes since 2022.
- Respondents were asked about any building materials that need more careful planning to avoid construction delays, recognizing that supply chains are back to normal. Windows and appliances were the most common answer—given by 20% of respondents each. To a lesser extent, garage doors were also an issue, dropping from the top issue as they had been for several quarters. Encouragingly, 49% stated that they are not concerned about the availability of any specific building material.
- A third of respondents said that they have difficulty meeting closing dates as a result of either building materials or labour issues. This group of builders reported a delay length of 10.6 weeks on average, a significant hinderance to rates of completion. In total, 30% of all builders are having trouble with meeting closing dates because of labour availability, and building material availability is affecting 10% of builders.
- The survey asked to characterize the labour market conditions and wage trends for trades. In terms of ease of access, the range of views were evenly represented across respondents. This suggests that acute labour challenges have been lessened by extended poor sales conditions as well as differences in access to specific types of trades. In terms of characterizing trades prices, 63% of builders stated that price of trades is up and 33% said they are stable.
- The average of builders’ estimated trades wage growth since the onset of the pandemic in 2020 was 33%, up from a reported 26% average in Q1 2023. In combination with the results of the previous question, trades wage growth is normalizing, but this growth is occurring on top of the large increases seen in years prior.
- When asked about recent layoffs, 40% stated they have not laid off workers. This is a smaller proportion than in recent surveys. Meanwhile, the 13% that stated that there are plans to rehire those who were laid off in the very near future was slightly higher than past quarters. This could be related to some hope that interest rate changes will help bolster headcounts.
- Statistics Canada data shows that industrial prices for framing lumber rose noticeably in early 2024. Since the beginning of 2020, the estimated average cost of lumber on a 2,400 square foot home incurred by a builder stands at $24,470.
- CHBA continued to ask builders about the rise in non-lumber material prices experienced since the start of 2020. Builders estimated that these costs have risen by $43,270 on a 2,400 square foot build. 55% of builders reported their non-lumber material costs have rise above $40,000, up from 47% of builders this time last year. Similar to consumer goods, closer-to-normal material price growth is being applied to the pandemic-era run up in prices and suggests that this is the ‘new normal’ in terms of costs of construction.
- This brings the total costs of construction material increases (lumber and non-lumber) to $67,740 compared to prior to the pandemic.
Special Question Results on Factory Built Construction
Following up from the questions surrounding factory-built construction methods first asked during 2023’s Q1 HMI survey, builders were asked if their business currently makes use of modular housing, manufactured homes, panelized components, or pre-engineered packages. Relative to 2023, panelized components remained the most prevalent factory construction method among builders at 26%. The 2% that reported using modular construction and 3% that used pre-engineered package methods in 2023 rose to 5% and 7% with the sample, respectively.
- Given the changes occurring in the industry, and in particular the labour shortage, builders were asked how seriously they are considering using various factory-built methods within their business over the next 1 to 3 years. 66% of builders said that they are considering panelized construction—which includes builders that are currently utilizing this method. Although the most prominent method, panelized construction was down from 90% in the 2023 survey. Part of this could be related to differences in survey sample or a legitimate decline in interest given market conditions. That said, using a subset of repeat respondents between 2023 and 2024, we found that 72% of those that had originally stated they were firmly interested in implementing panelized construction methods remained interested a year later, while 19% who originally said they may be considering panelized construction now are no longer considering it a year later. That said, 38% of the builders who originally said they were not considering factory-built options are now giving it some thought. Therefore, despite the total sample decline, there is evidence that panelized adoption will increase over the next few years.
- Both the use and medium-term consideration for modular housing improved relative to 2023, but total uptake remains low. 5% stated they have produced a modular home over the past year, up from 2% in 2023, and a total of 10% said they are firmly considering modular over the next 1 to 3 years—relative to 4% last year. With increased government focus on derisking this technology, adoption could accelerate over the years ahead.
- Builders were asked to characterize their familiarity with factory-built methods in a broad sense as well as its separate benefits related to improving business productivity and addressing climate change factors (i.e. emission reductions and improved resiliencies). About two thirds have familiarity with factory-built methods and the productivity benefits, and 57% are familiar with the benefits for addressing climate change factors.
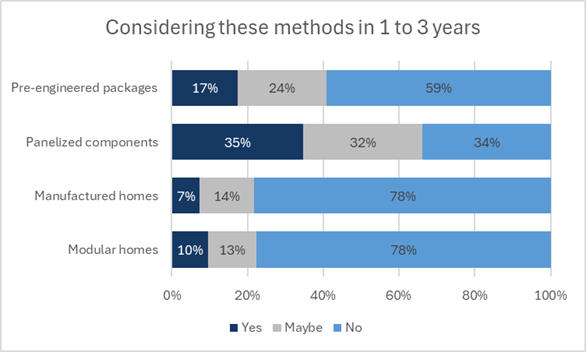
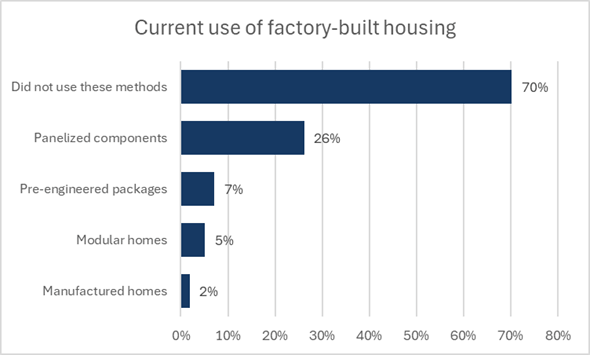
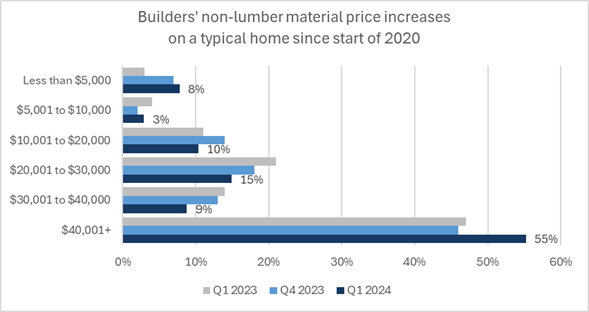
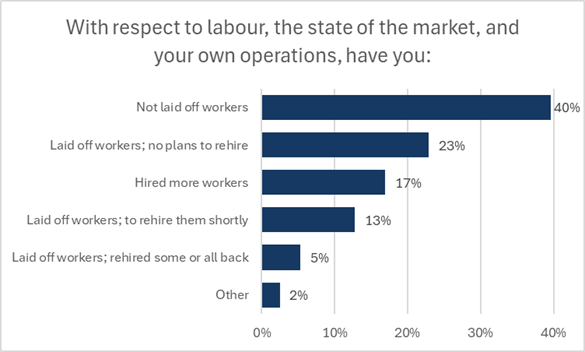
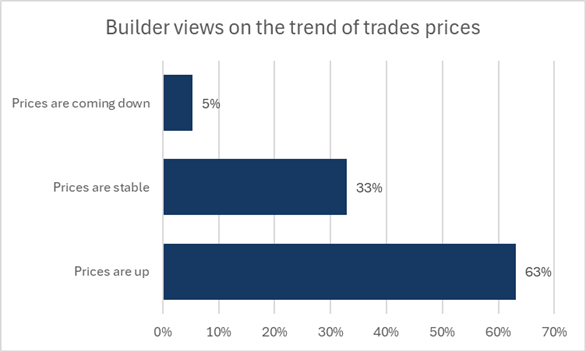
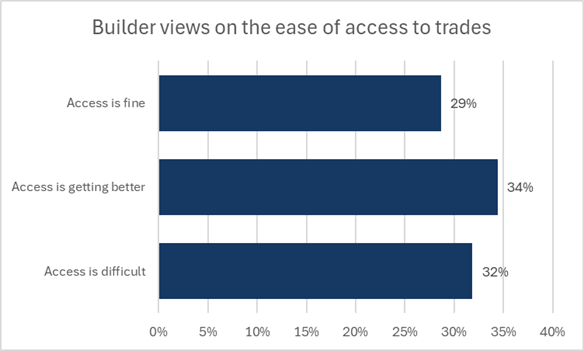
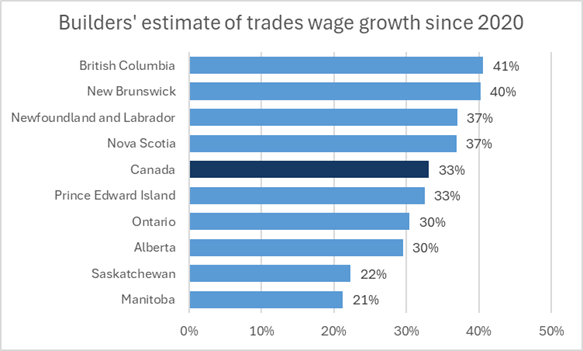
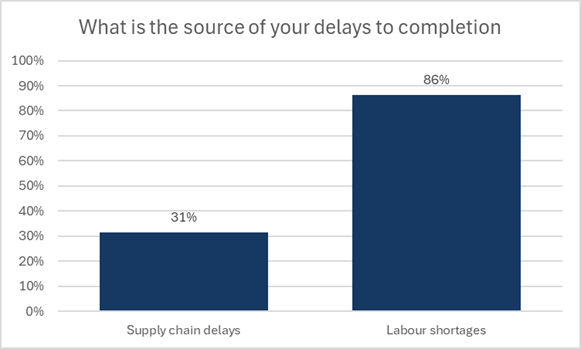
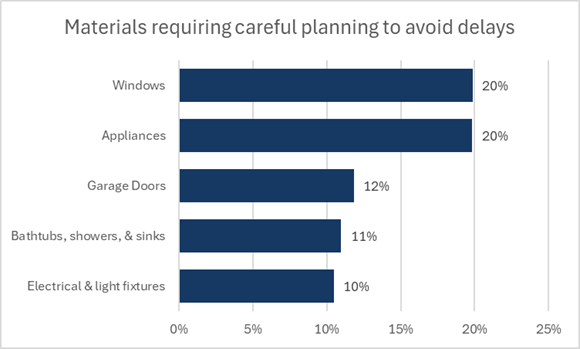
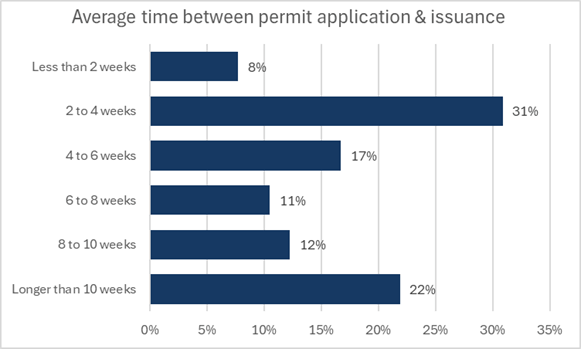
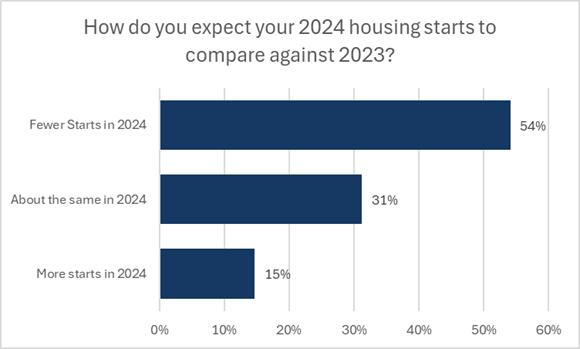
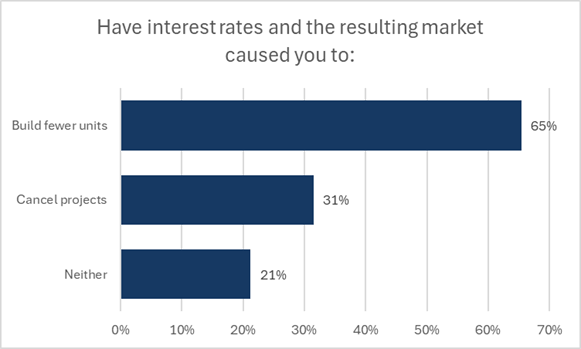
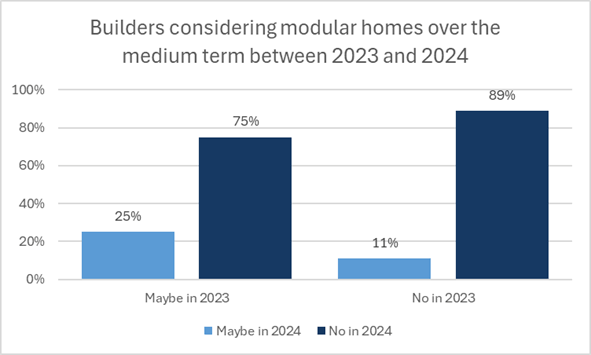
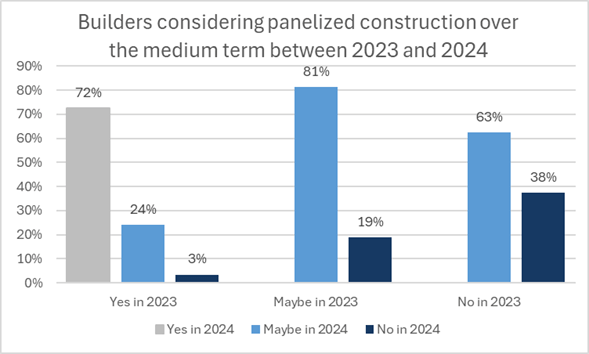
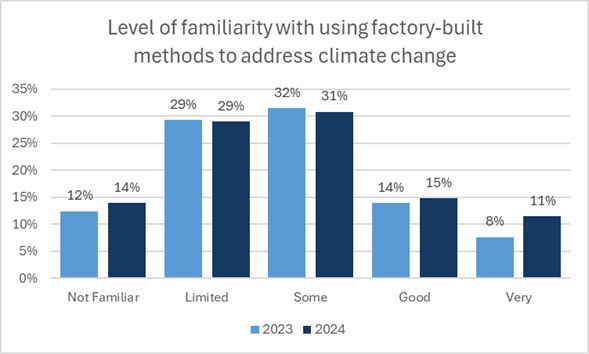
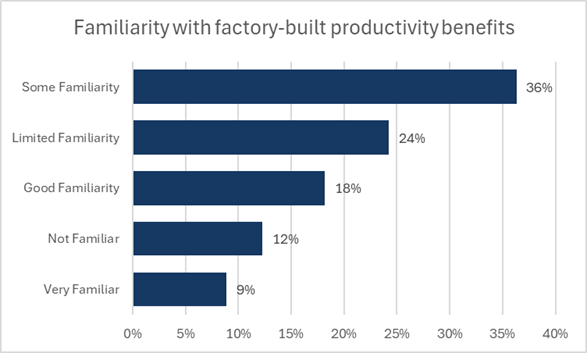
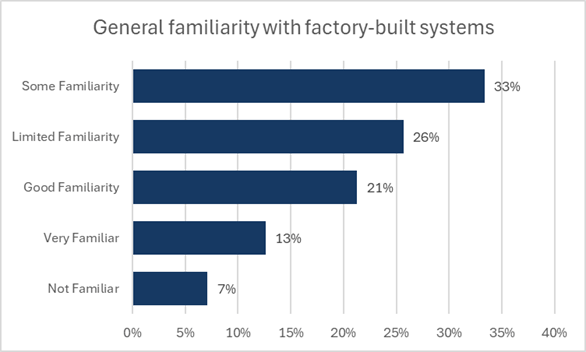
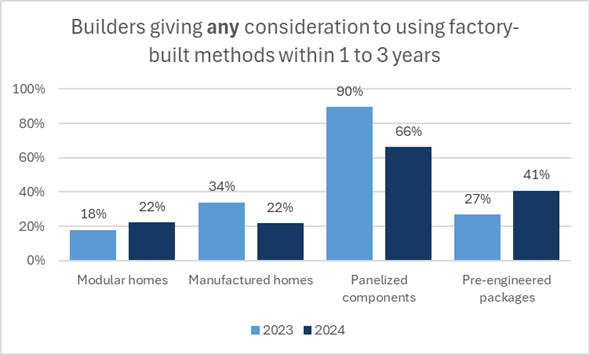
- The CHBA Single-Family Housing Market Index fell to a historical low of 24.6 in Q4 2023, the most negative quarterly sentiment reading in the three years CHBA has been conducting the survey. The index fell 9.3 points from a reading of 33.9 in Q3 2023 and is 1.6 points below the previous record low of 26.2 recorded in Q4 2022.
- The record low sentiment readings represent a continued decline in serious and qualified buyers looking to purchase a new home. In addition, builders commented that some buyers are waiting on the sidelines with the belief of lower mortgage rate offerings in 2024.
- For an approximate comparison, the US NAHB’s single-family HMI averaged 37 in the fourth quarter of 2023, down from an average reading of 45 in Q3 2023, but still better than the Canadian numbers.
- The Q4 2023 single-family sub-indices for present selling conditions, expectations for future selling conditions, and sales office traffic fell to levels that were all lower than the previous quarter and the previous record low seen in Q4 2022.
- As with previous quarters, the proportion of builders holding pessimistic views were broadest in Ontario. However, single-family sentiment deteriorated in all regions of the country over Q3 2023.
- 57% of single-family builders rated current selling conditions as Poor, worsening nearly 10 percentage points from the previous quarter. Regionally, except for the Atlantic region, most builders characterized current selling conditions as Poor.
- Influenced by several factors, views about future selling conditions were closely split between Poor (45%) and Fair (43%). However, the proportion of builders that were optimistic about conditions in the next six months fell six percentage points from Q3 2023 to 12%. Rating future conditions as Fair was most common in all regions outside of Ontario, where the most common rating was poor.
- The collective view on sales office traffic was the most pessimistic of the sub-indices, with 73% giving a Low or Very Low rating. Several builders commented that traffic was especially slow even when considering that it is a seasonally slow time of the year for inquiries from prospective buyers. Just 2% of builders surveyed rated sales traffic conditions as High or Very High.
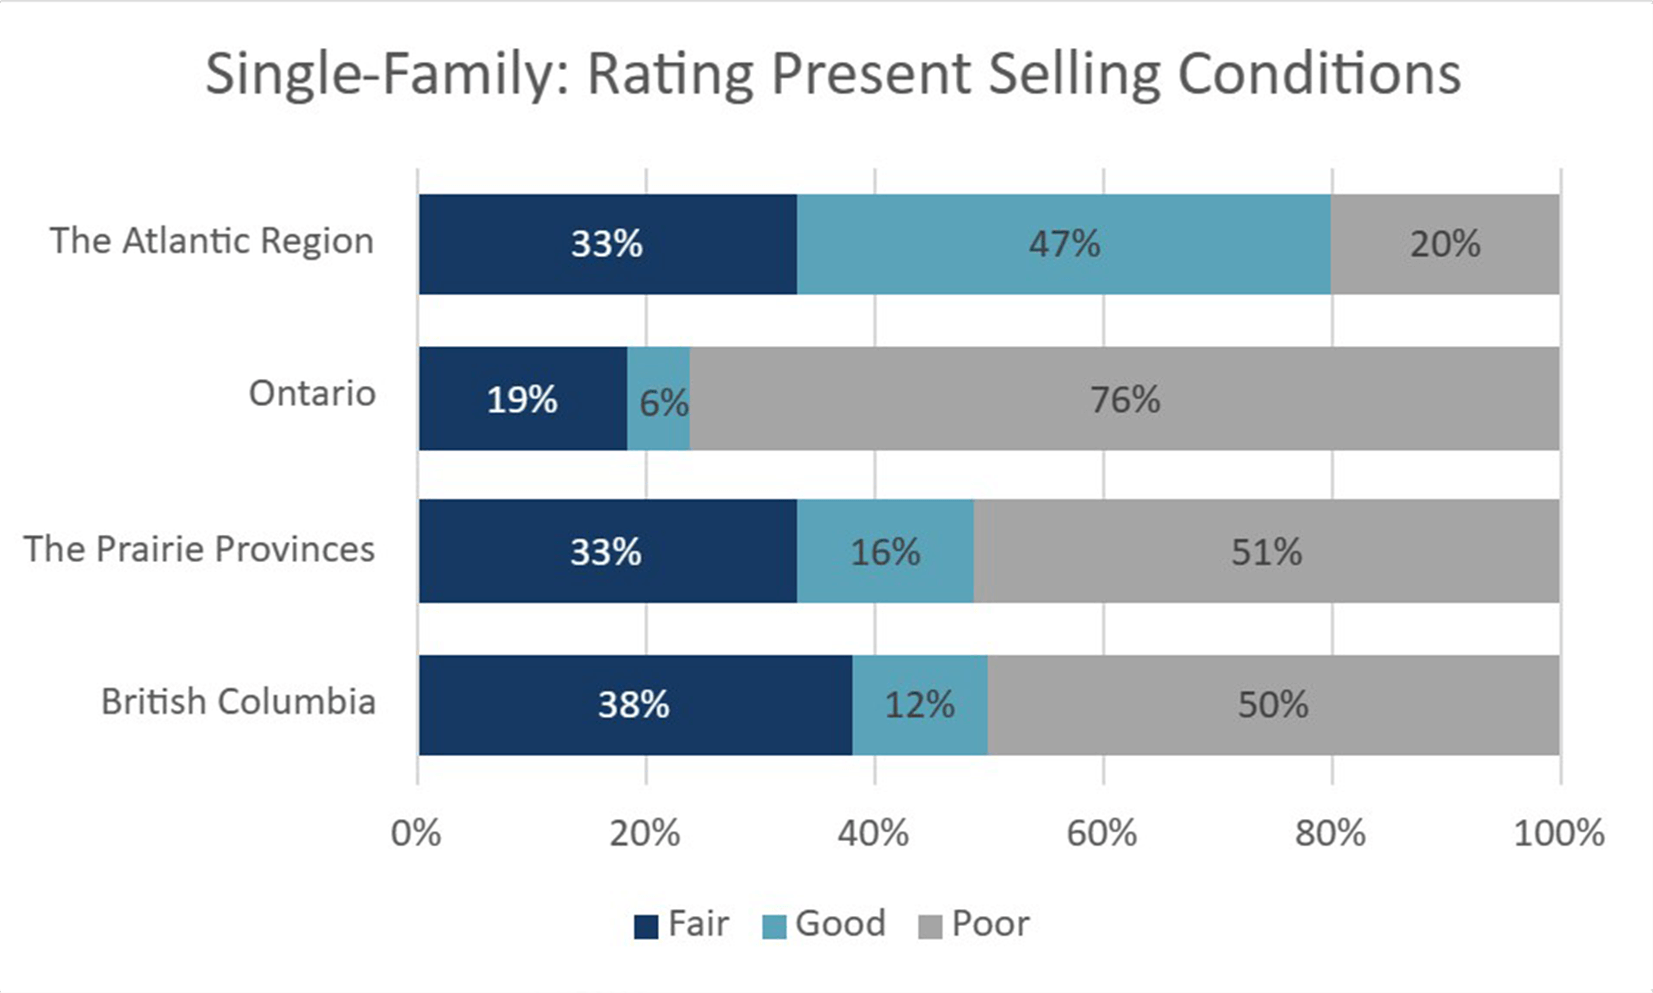
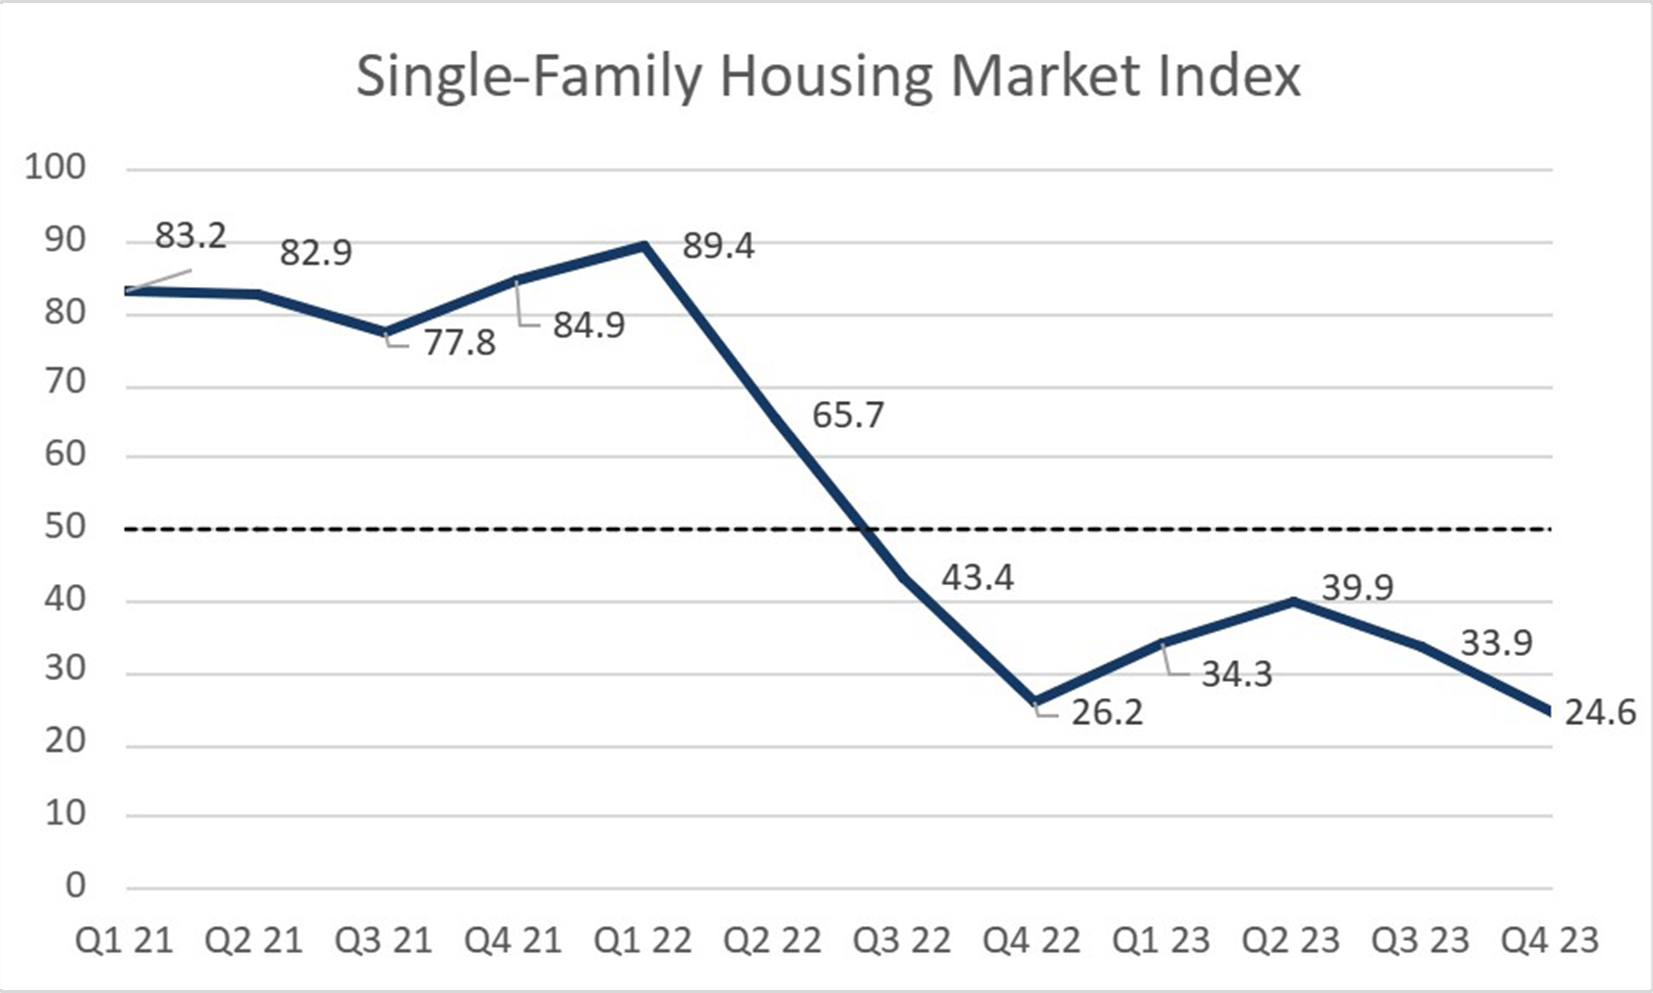
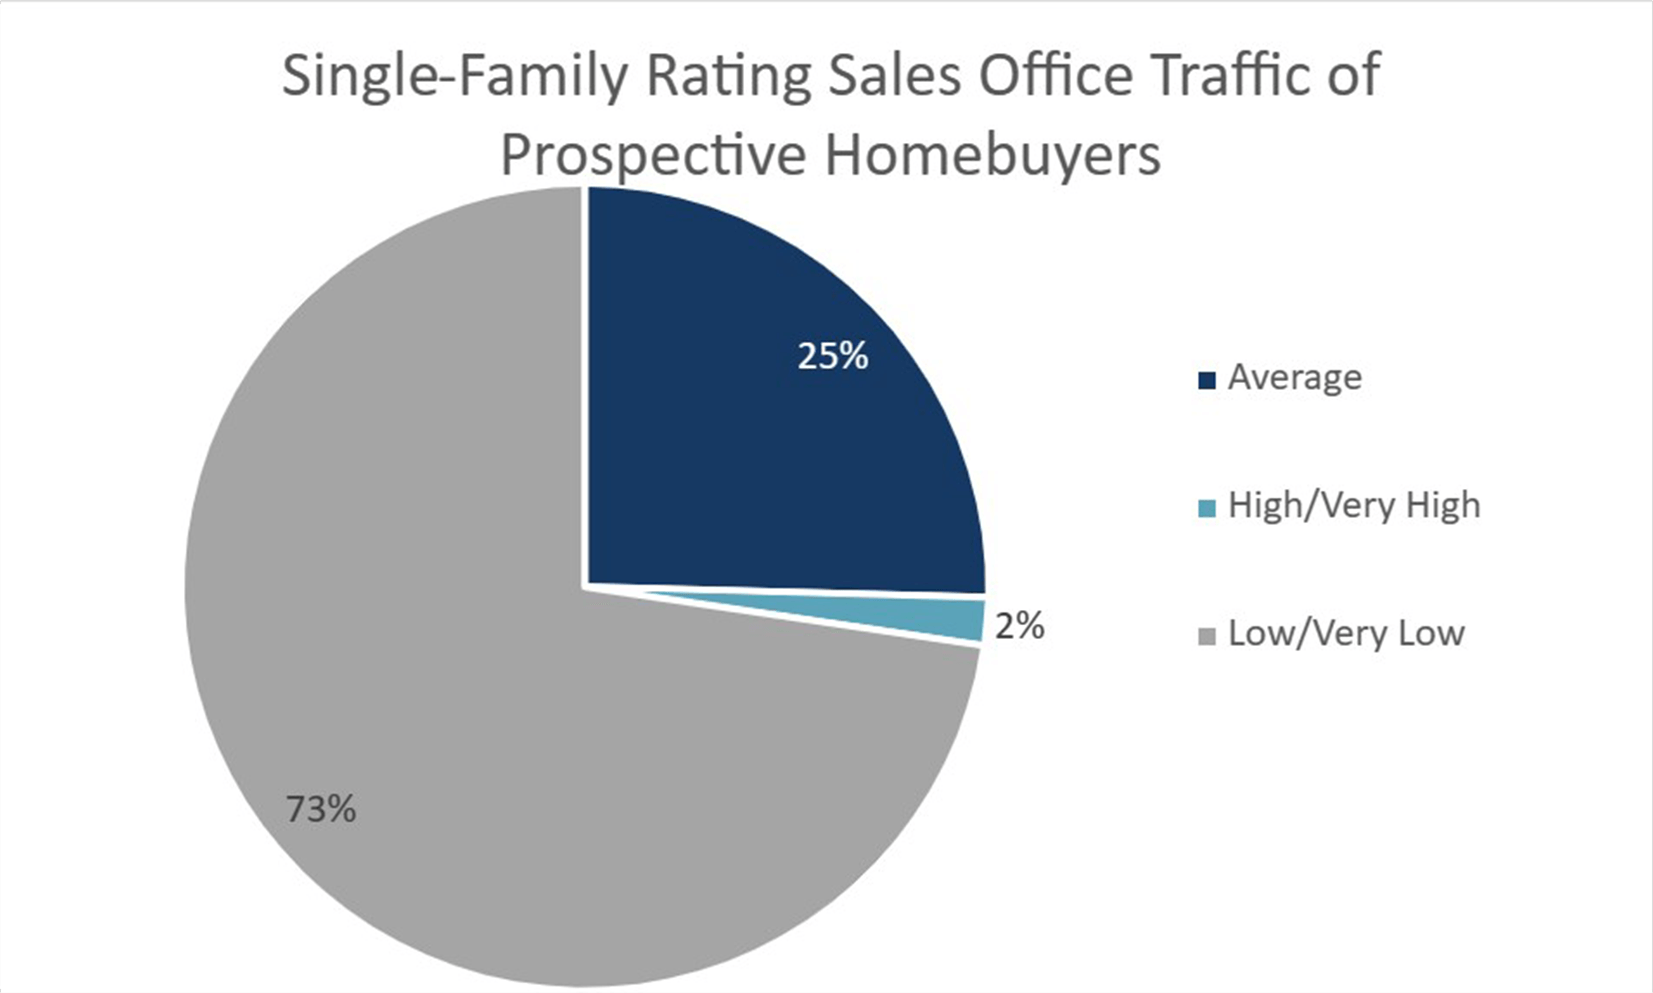
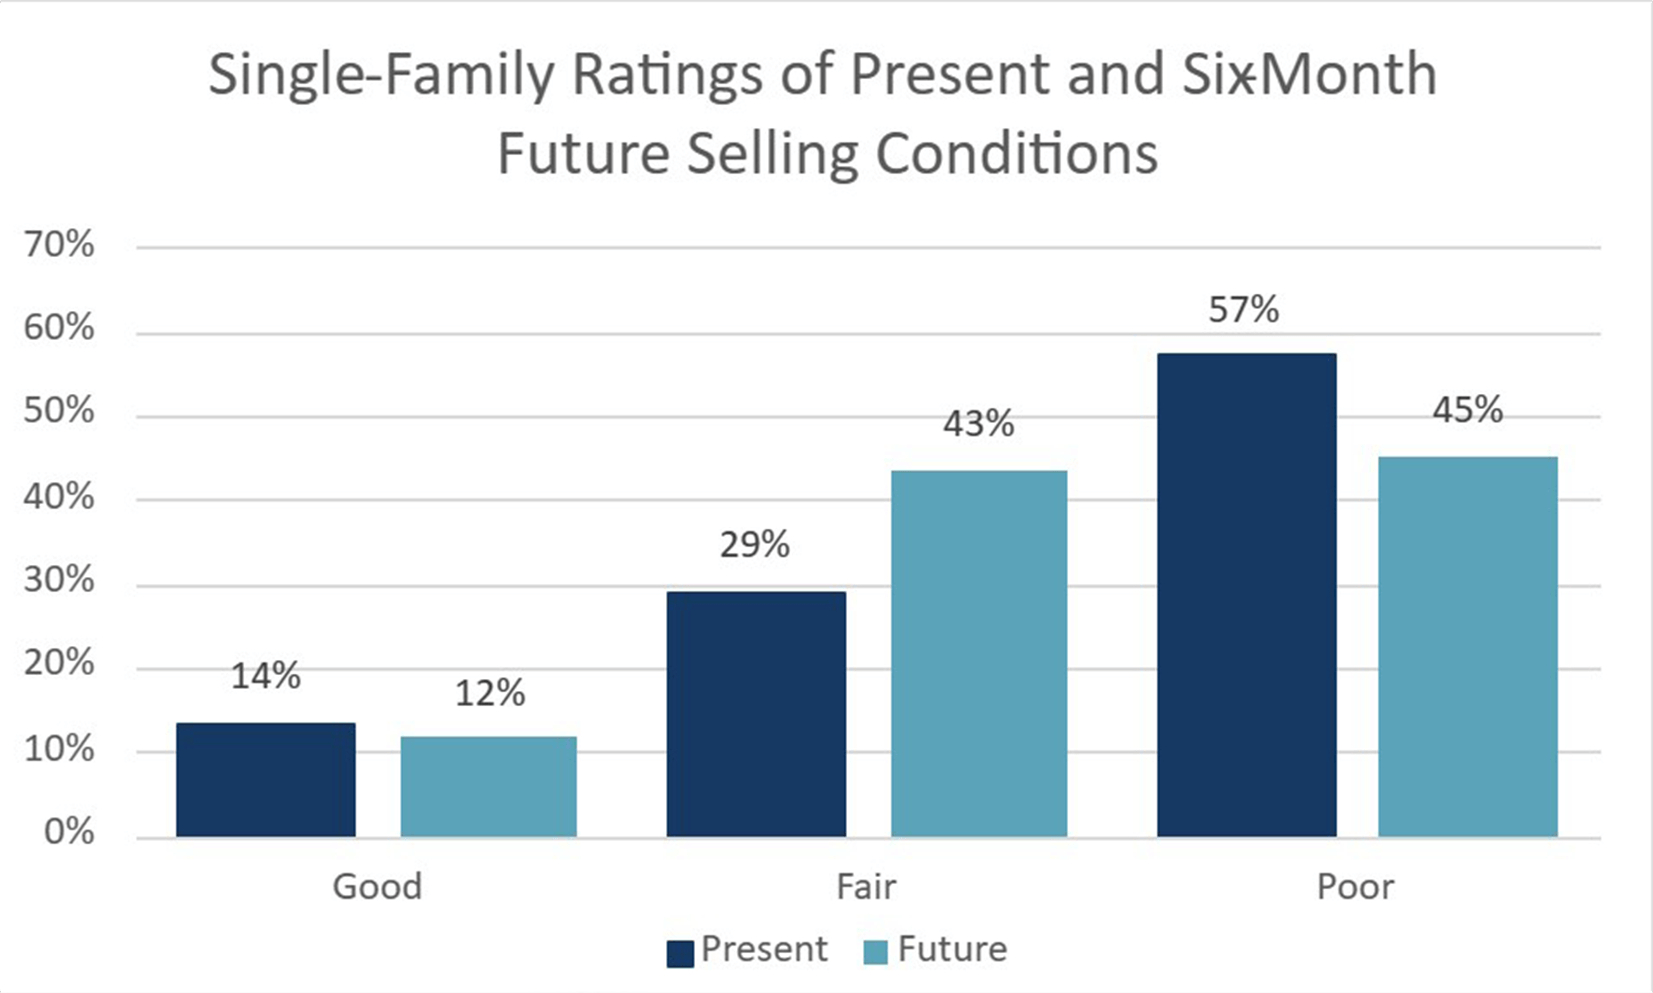
- The CHBA HMI for multi-family builders was down to 29.1 in Q4 2023. The index fell 4.5 points from a value of 33.6 in Q3 2023. The declines seen in the second half of 2023 leaves sentiment marginally above its 3-year low of 26.0 recorded in Q4 2022.
- Regionally, downbeat views from multi-family builders were most broadly held in Ontario as well as British Columbia. This is despite strong annual growth in multi-unit starts in both Toronto and Vancouver in 2023, reflecting projects that were approved before the climb in interest rates. Meanwhile, the balance of sentiment was neutral among builders responding from Prairie provinces.
- The majority of multi-family respondents, at 53%, rated current selling conditions as Poor. The increase in the proportion of those giving a Poor rating over last quarter came from a decline in the proportion of respondents that gave a Fair rating. Builders that gave current selling conditions a Good rating held steady from Q3 2023 at only 13%.
- Expectations about future selling conditions were balanced, with 47% of builders giving a Fair rating. This was higher than the 32% of multi-family builders that gave a Poor rating. Only 21% expect future conditions to be good.
- 63% of multi-family builders rated traffic of prospective homebuyers to be Low or Very Low, up a substantial 22 percentage points from the previous quarter. This came from a large drop in the proportion of builders that said sales traffic was average, which now stands at 31%.
- Relative to Q4 2022, multi-family builder views on current selling conditions and sales traffic levels were quite similar in Q4 2023 survey.

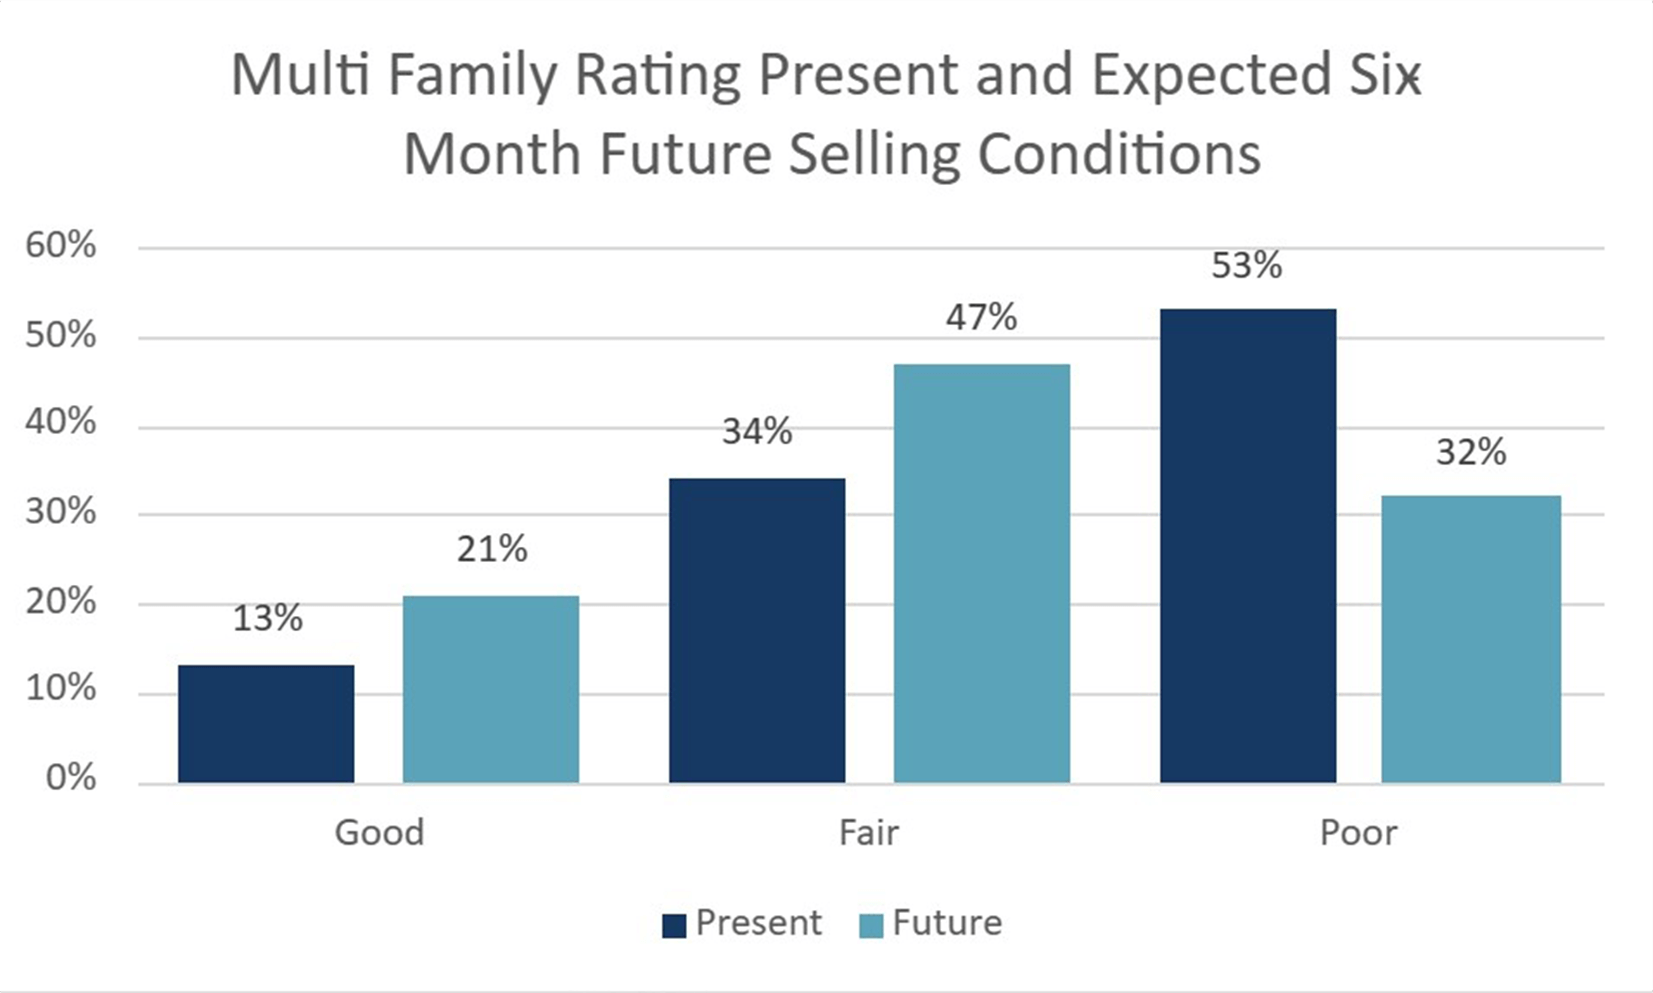
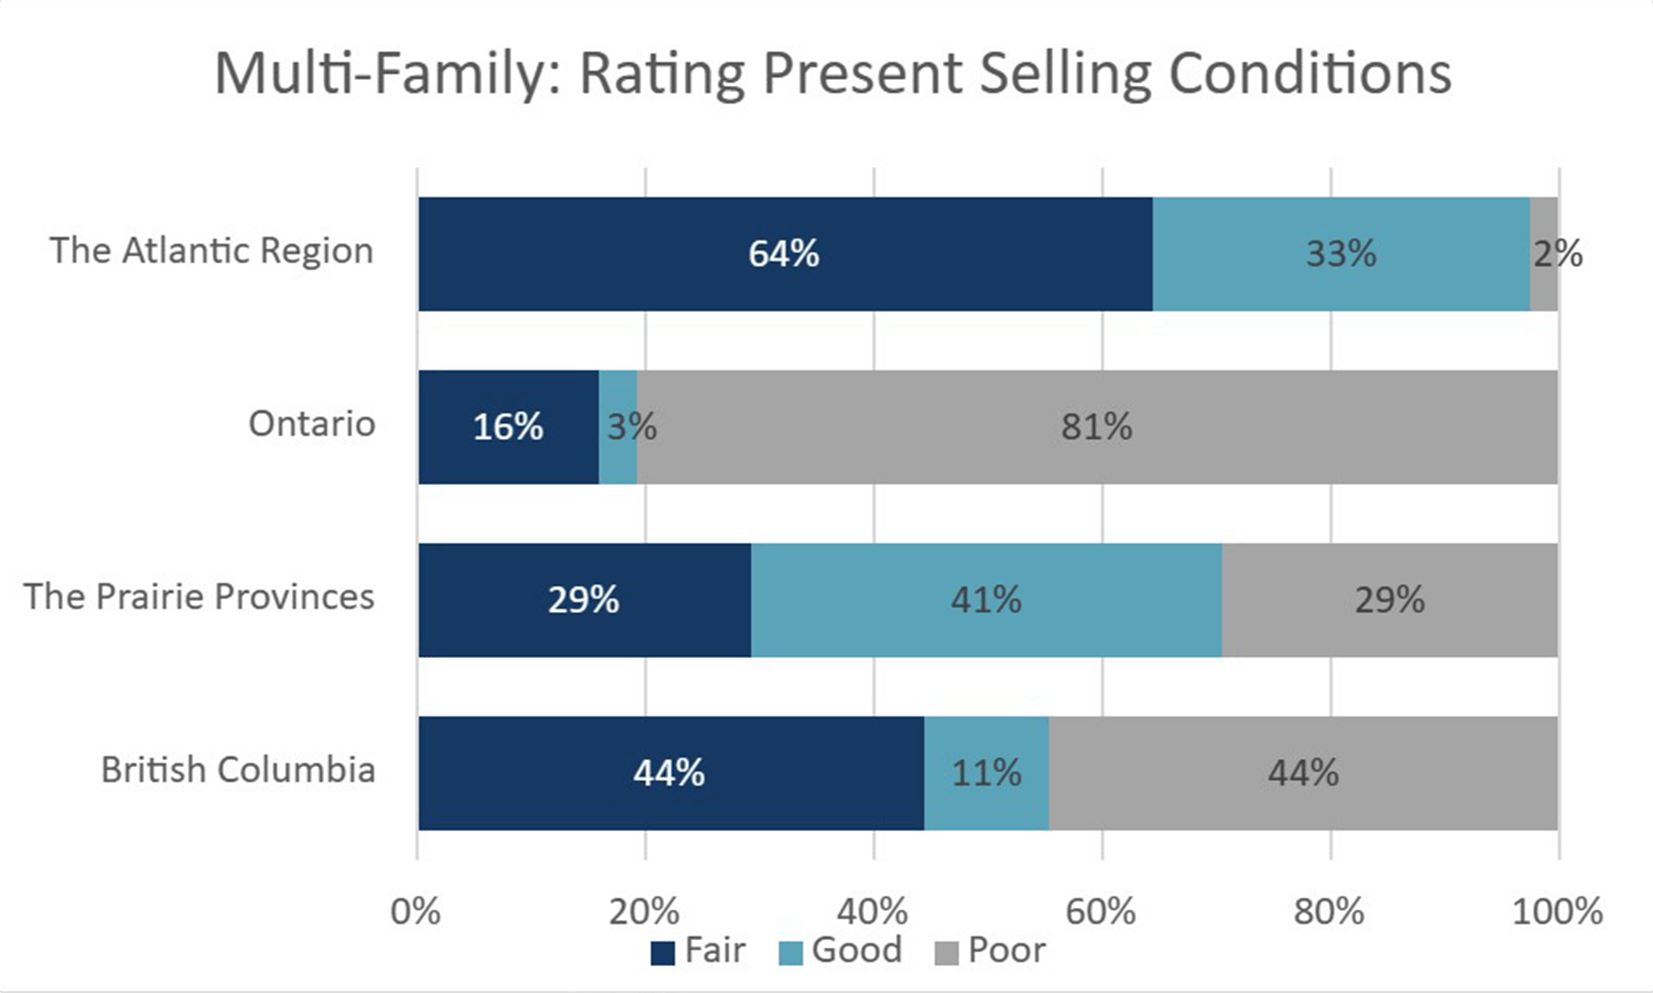
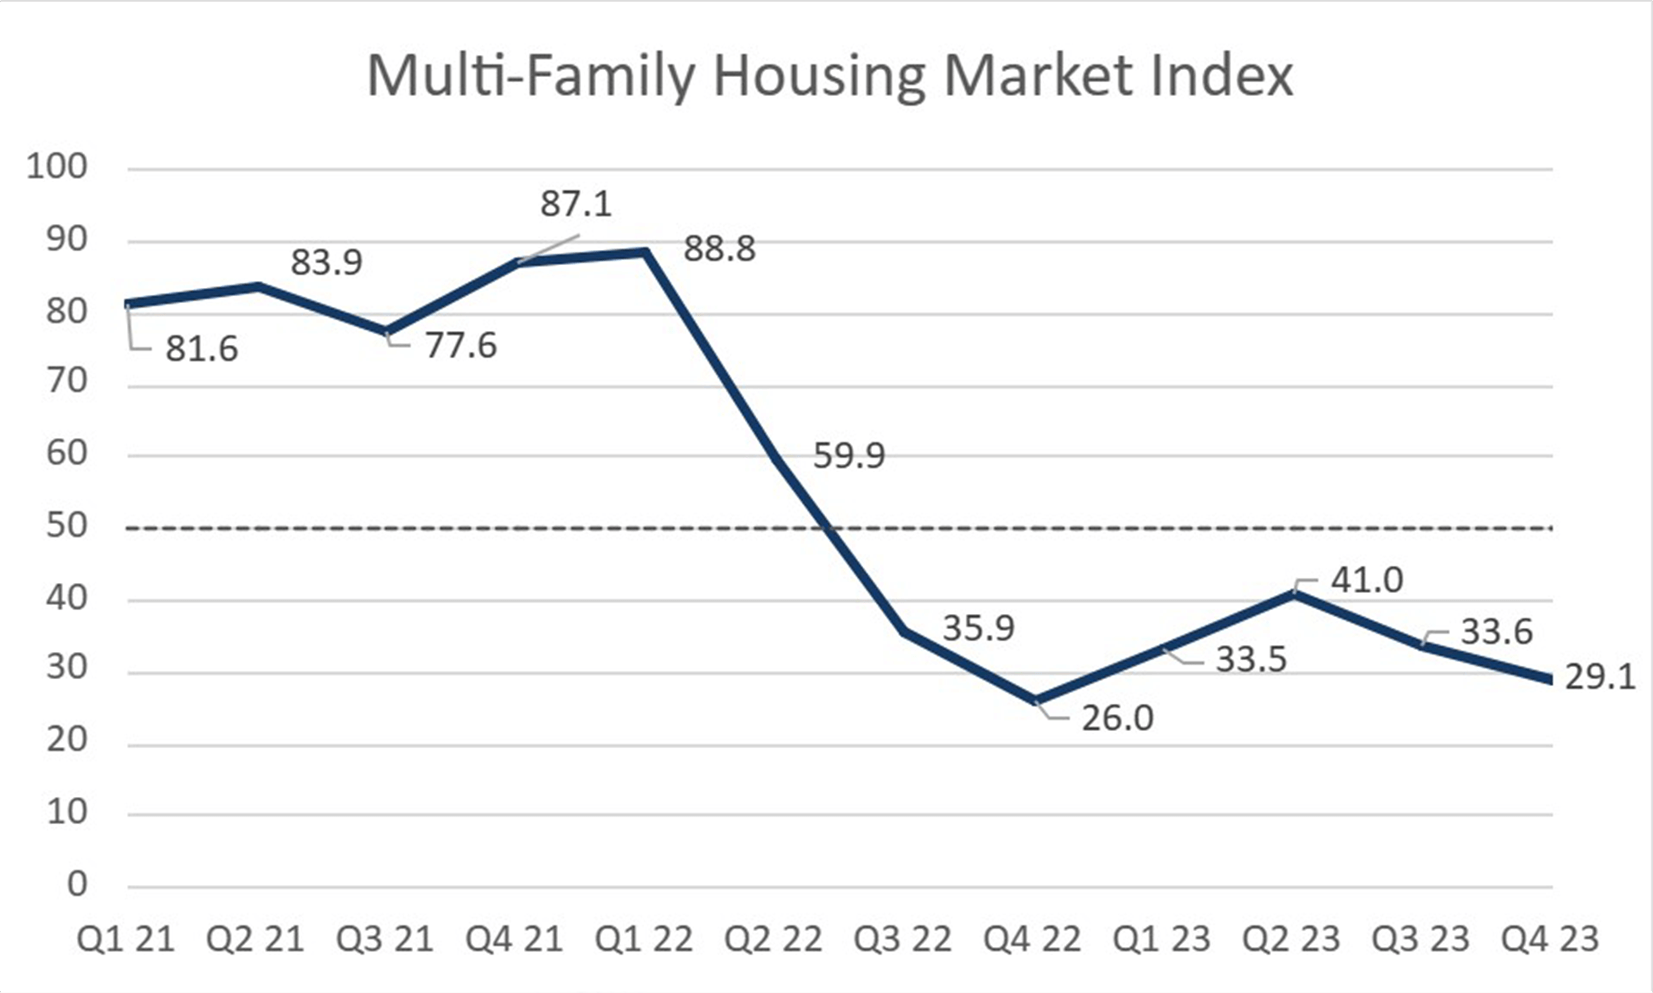
These questions allow CHBA to better understand what is driving change in builder sentiment and gain insights into current industry issues. The following are some of the findings from the special questions in the Q4 2023 survey:
- Assessing the cumulative impact of interest rate hikes on their sales office traffic, 41% of builders stated that their sales traffic is down and they have not yet seen a recovery in traffic flow. A further 30% of builders noted that not only has prospective buyer traffic not seen a recovery, but it has also worsened as of late.
- Builders were asked a follow up question about prospective buyer traffic after the Bank’s rate hold announced in late October. In the first half of 2023, a four-month pause in interest rate hikes corresponded to a modest improvement in both HMI readings. However, this was the case in Q4. 65% of builders reported that sales traffic remains weak, and another 5% reported that traffic has slowed even more.
- Builders were asked if they have had to scale back their operations as a result of the interest rate environment in 2023 and the results were somewhat consistent with the prior quarter. 64% stated that it has caused them to build fewer units and 30% of builders stated that they canceled projects as a result.
- With respect to the concern they currently have about the future of their business, 45% of builders stated that they are somewhat concerned and 28% said they are concerned. 11% stated they did not have any concern.
- Builders continue to face difficulties with closing past sales. 37% of respondents stated that buyers have sought alternative lending solutions and 30% said that they’ve made accommodations so that buyers can close.
- With the majority of the year complete, builders were asked to report how their annual housing starts compare to the number of starts in 2022. 61% of builders surveyed stated that they expect to have started fewer builds in 2023 relative to 2022, while just 9% said they expect their starts to have increased.
- Out of the builders that said they expect to build fewer units in 2023, they expect to have reduced their starts on average by 47%. The average expected percentage decrease in 2023 starts was higher among small and medium builders.
- We asked about builder expectations for their number of starts in 2024, based on demand conditions over the previous 12 months. 41% of builders stated they expect to build about the same number as they will in 2023. Closely behind, 36% reported that they expect to start fewer homes next year.
- Builders were also asked to provide any other comment about their starts expectations for 2024 and while focused on interest rates, builder rationale varied. Several builders stated their belief around maintaining their number of starts as 2023 was due to the expectation of rate cuts. Other comments stated that 2024 will certainly be lower, as 2023 was used to catch up on delayed projects from 2022.
- Beyond interest rates, builders were asked to identify other pertinent factors that are also constraining their housing starts. As with Q3, municipal processes was the most widely reported pain point lowering a builder’s number of starts—at 47% of builders. 30% of builders noted a lack of adequate labour remains an issue, while 28% stated that access to land is difficult.
- When asked the same question but under a hypothetical situation where market conditions were better, the proportion of builders stating that a lack of labour would hold them back increased to 39%. The proportions of other stated factors were similar to the answers from the original question.
- With the lowering of sentiment and weak sales conditions, 33% of builders reported laying off workers - 9% expect to rehire but 24% do not.
- Builders were asked about the cost and the availability of trades. 51% of builders stated that the cost of trades is up. Some builders commented that access has improved because of the weak local market conditions and that delays due to trades access will return when those conditions improve.
- On average builders estimate that their trades costs have increased 33% since the onset of the pandemic. So as more normal wage growth resumes, this is on top of large increases in the recent past, which is also the case for many other costs incurred by builders.
- Supply of inputs, especially building materials, have improved over the course of 2023 as demand for new homes weakened and supply chains normalized. The nationwide average construction delay as a result of a lack of materials or labour trend downwards towards normal, but is still at 6 weeks delay compared to normal. This is down from an average of 7 weeks over the previous two quarters and down from 10 weeks in Q4 2022.
- As with previous quarters, appliances and garage doors were the two building material categories with the highest incidence of being in serious shortage at 9% and 8%, respectively. 21% of builders stated they did not experience noteworthy material shortages this quarter, which would be good if it weren’t coupled with the slowdown in construction activity overall.
- Although lumber prices and sharp market price swings have normalized, survey respondents reported that lumber has increased the cost of construction from the onset of the pandemic on a 2,400 square foot home by a national average of $23,400. This average has remained fairly consistent over 2023.
- We also continued to ask about the increase in construction costs from non-lumber building materials. 77% of respondents said that their costs have gone up by more than $20,000 since the start of the pandemic. The national average construction cost increase for a 2,400 square foot home is $42,216. This average has remained well above $40,000 throughout 2023 and is unlikely to see a broad or material decrease in the near future.
- This puts the total cost of materials for construction (lumber and other materials) compared to prior to the pandemic up over $65,500 for a 2,400 square foot home.
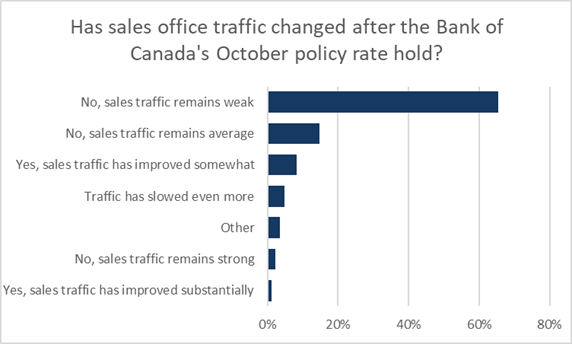
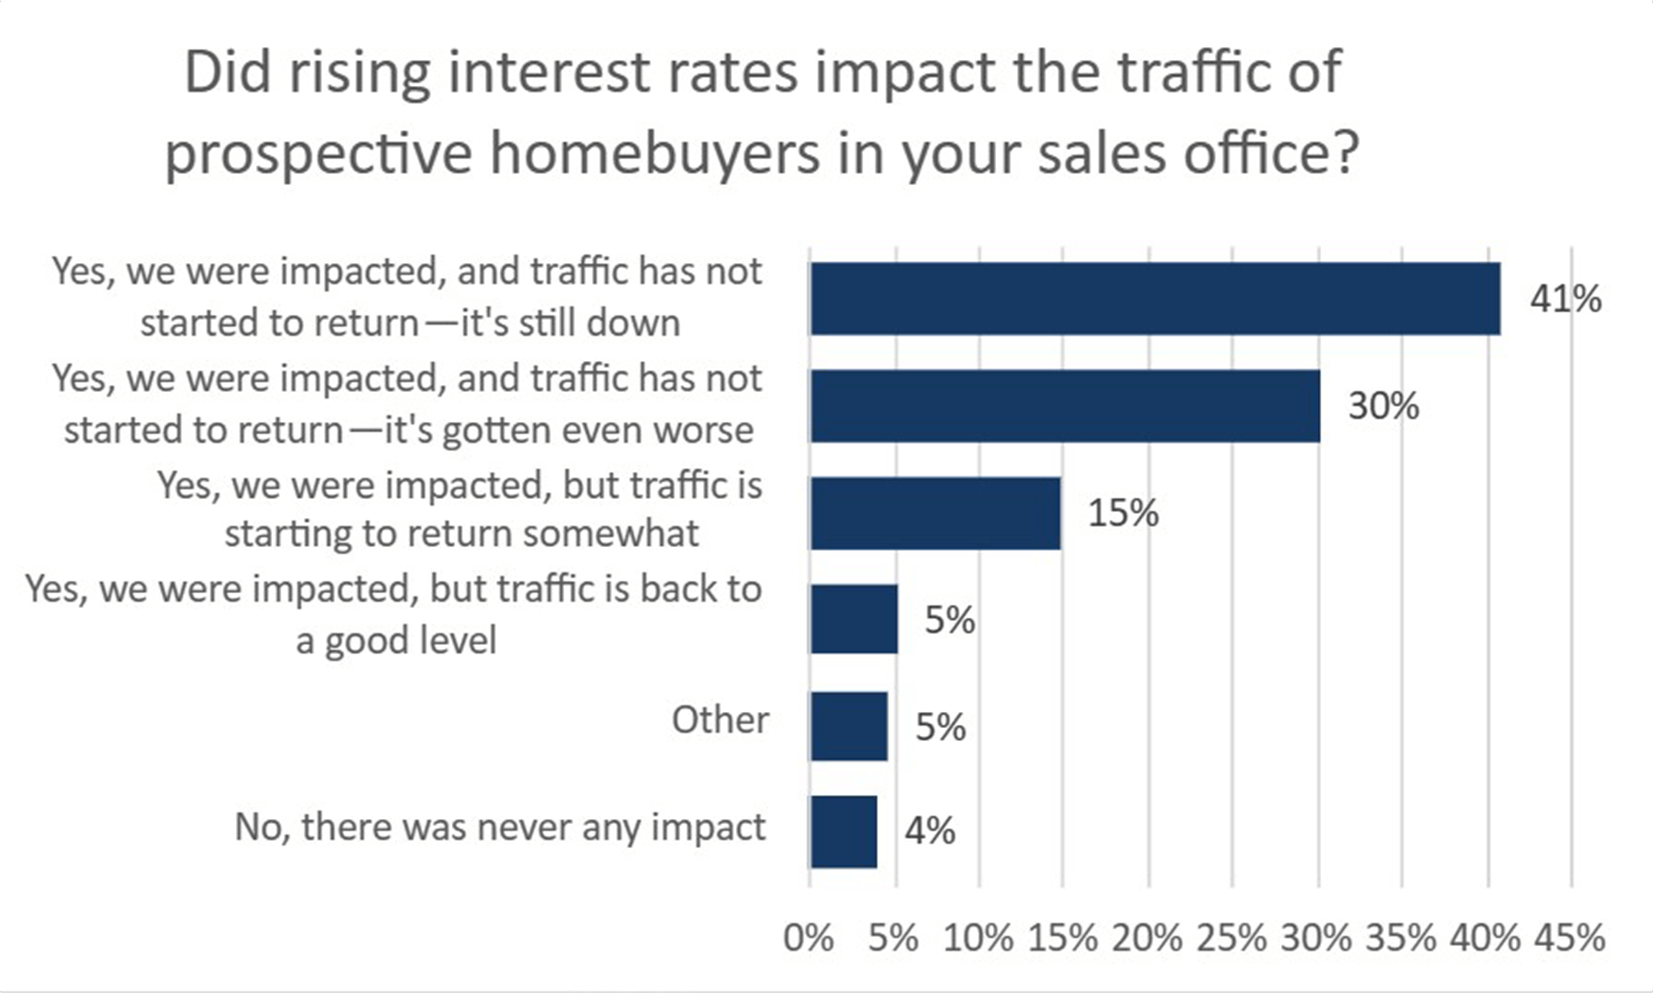
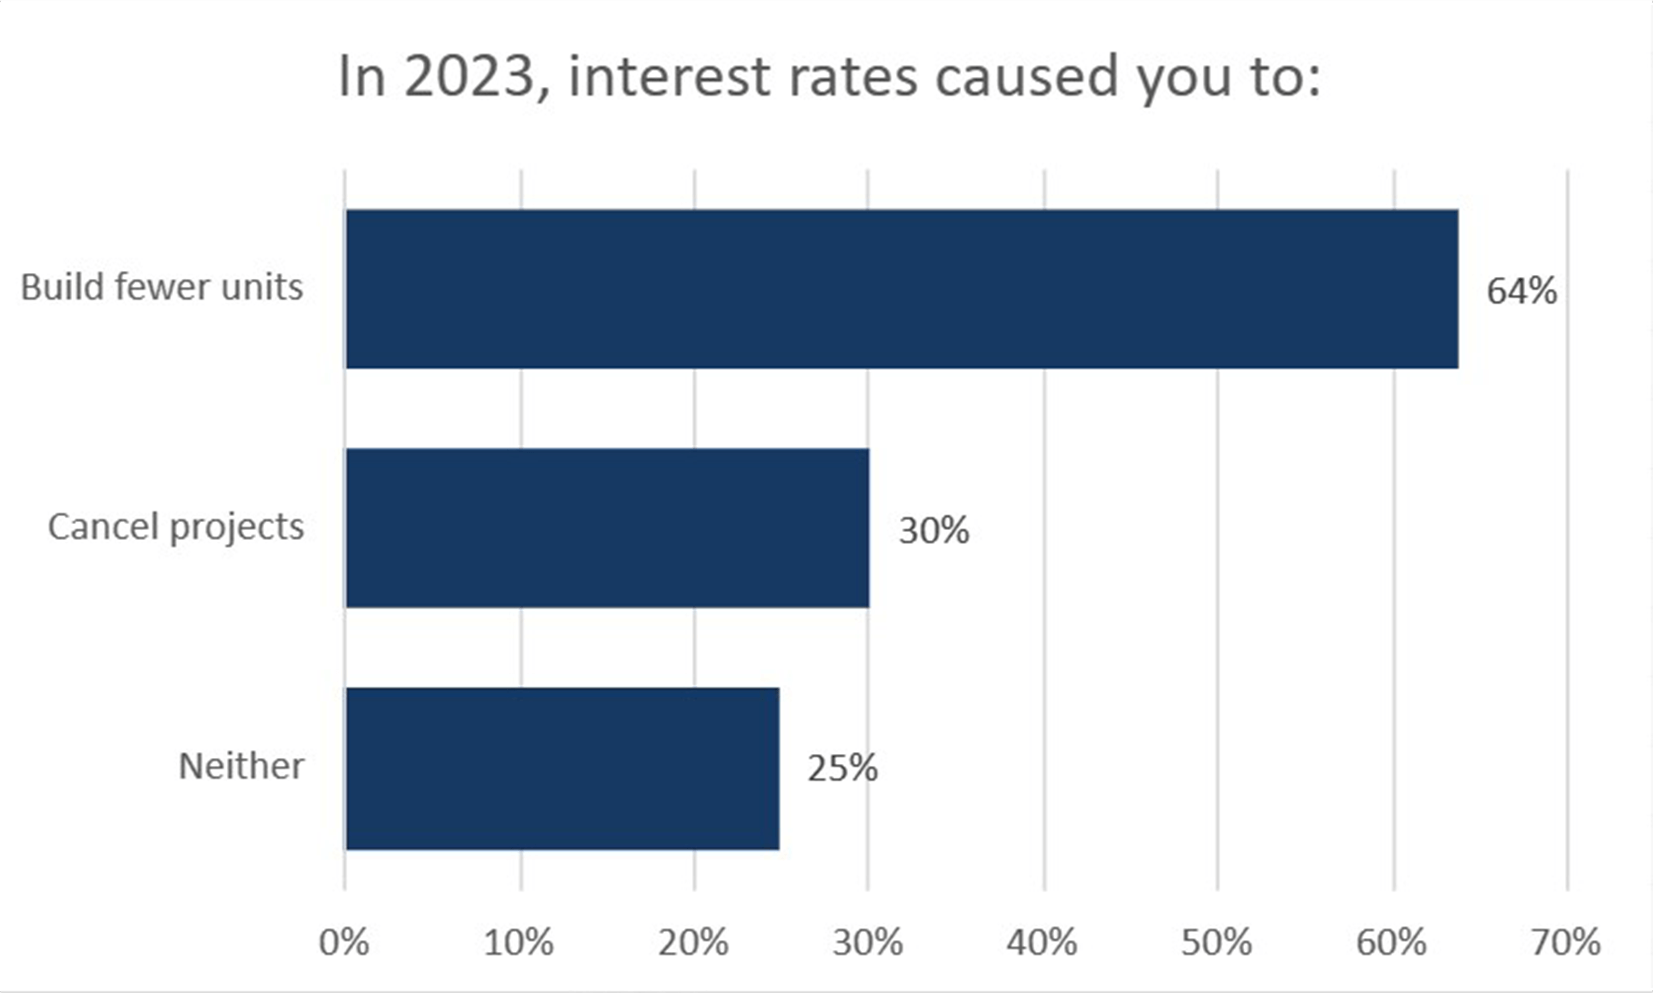
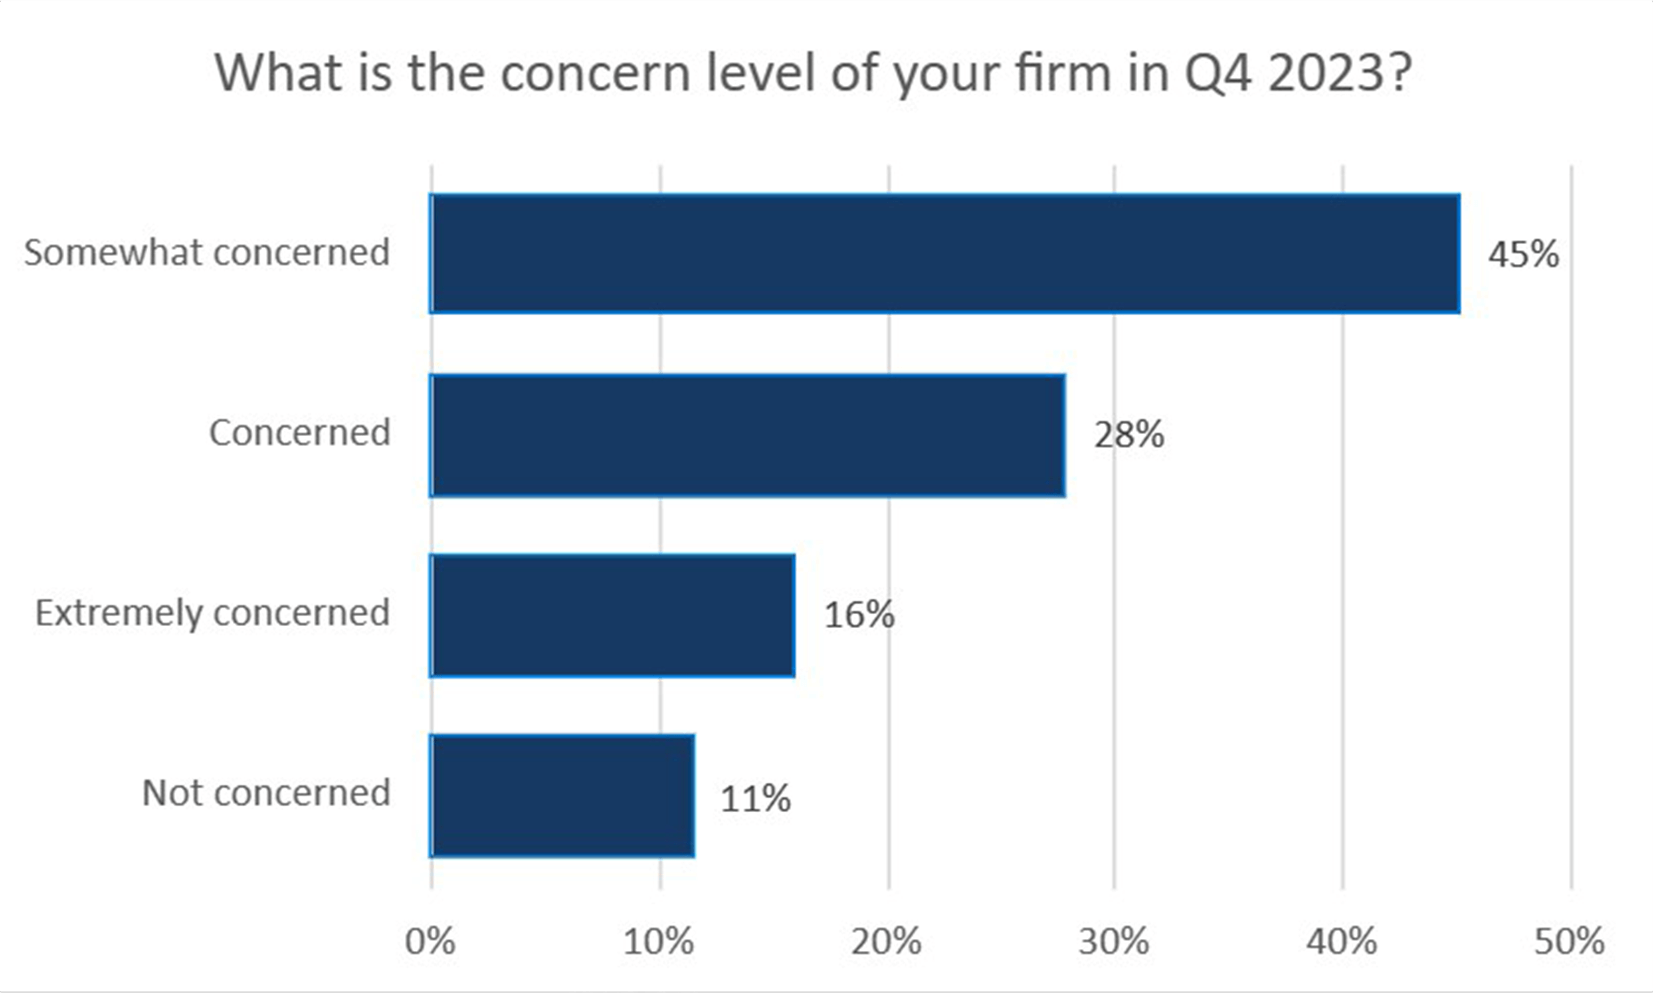
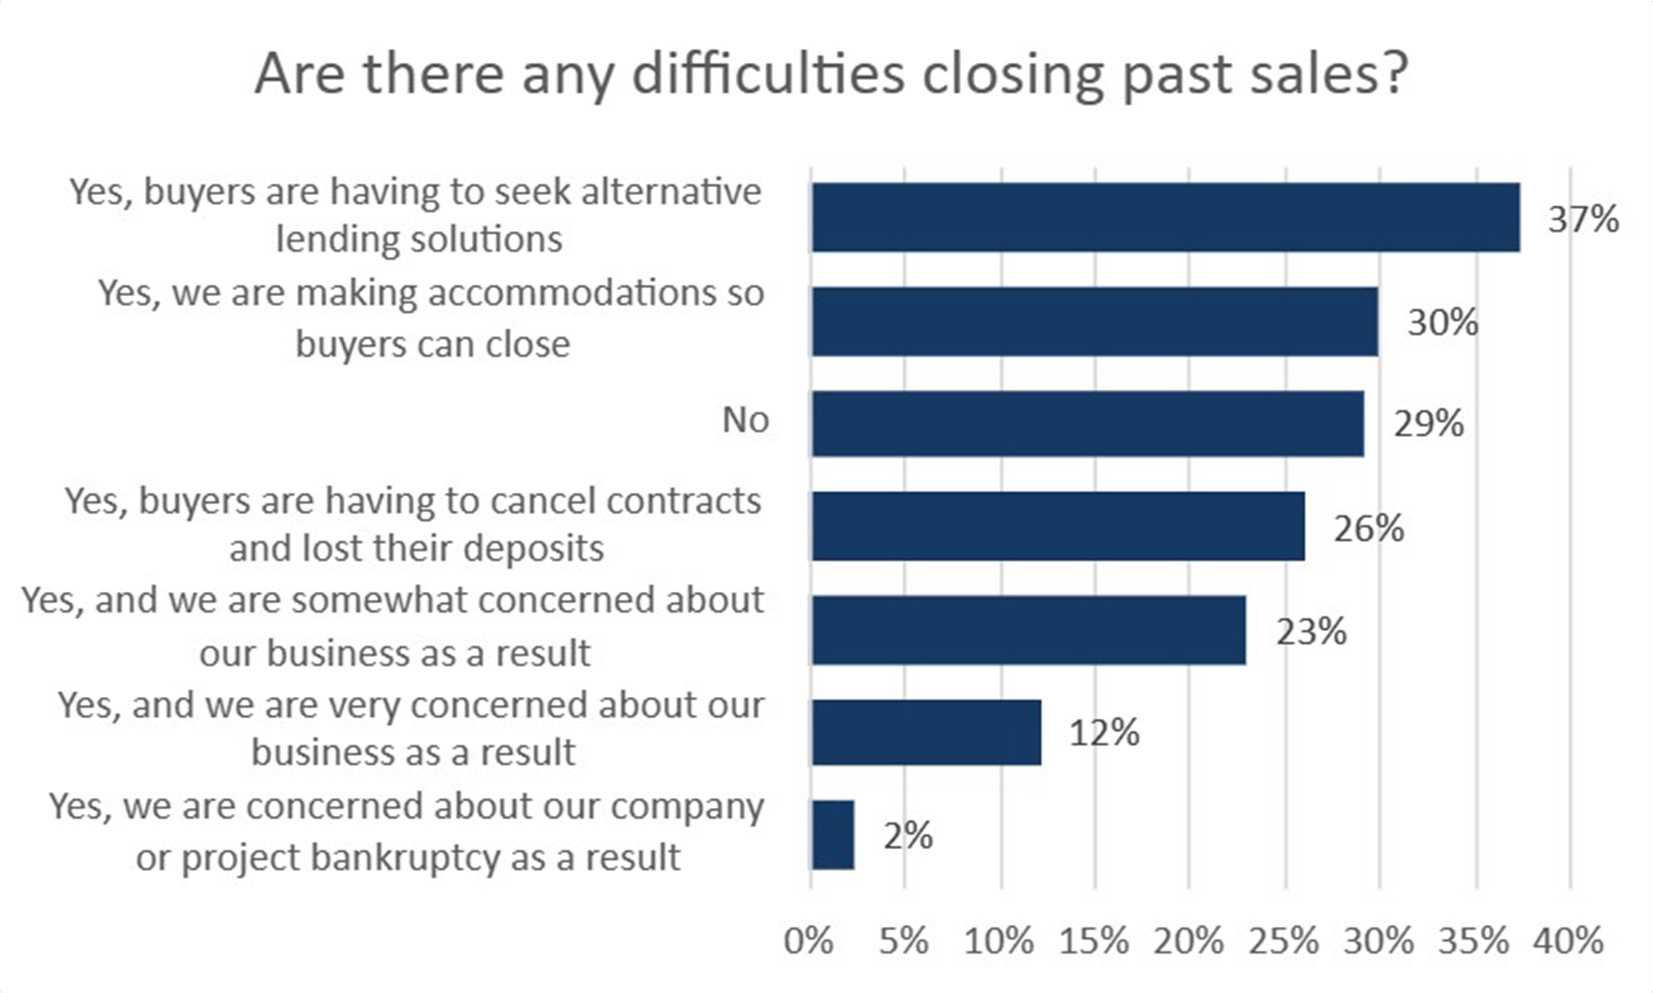
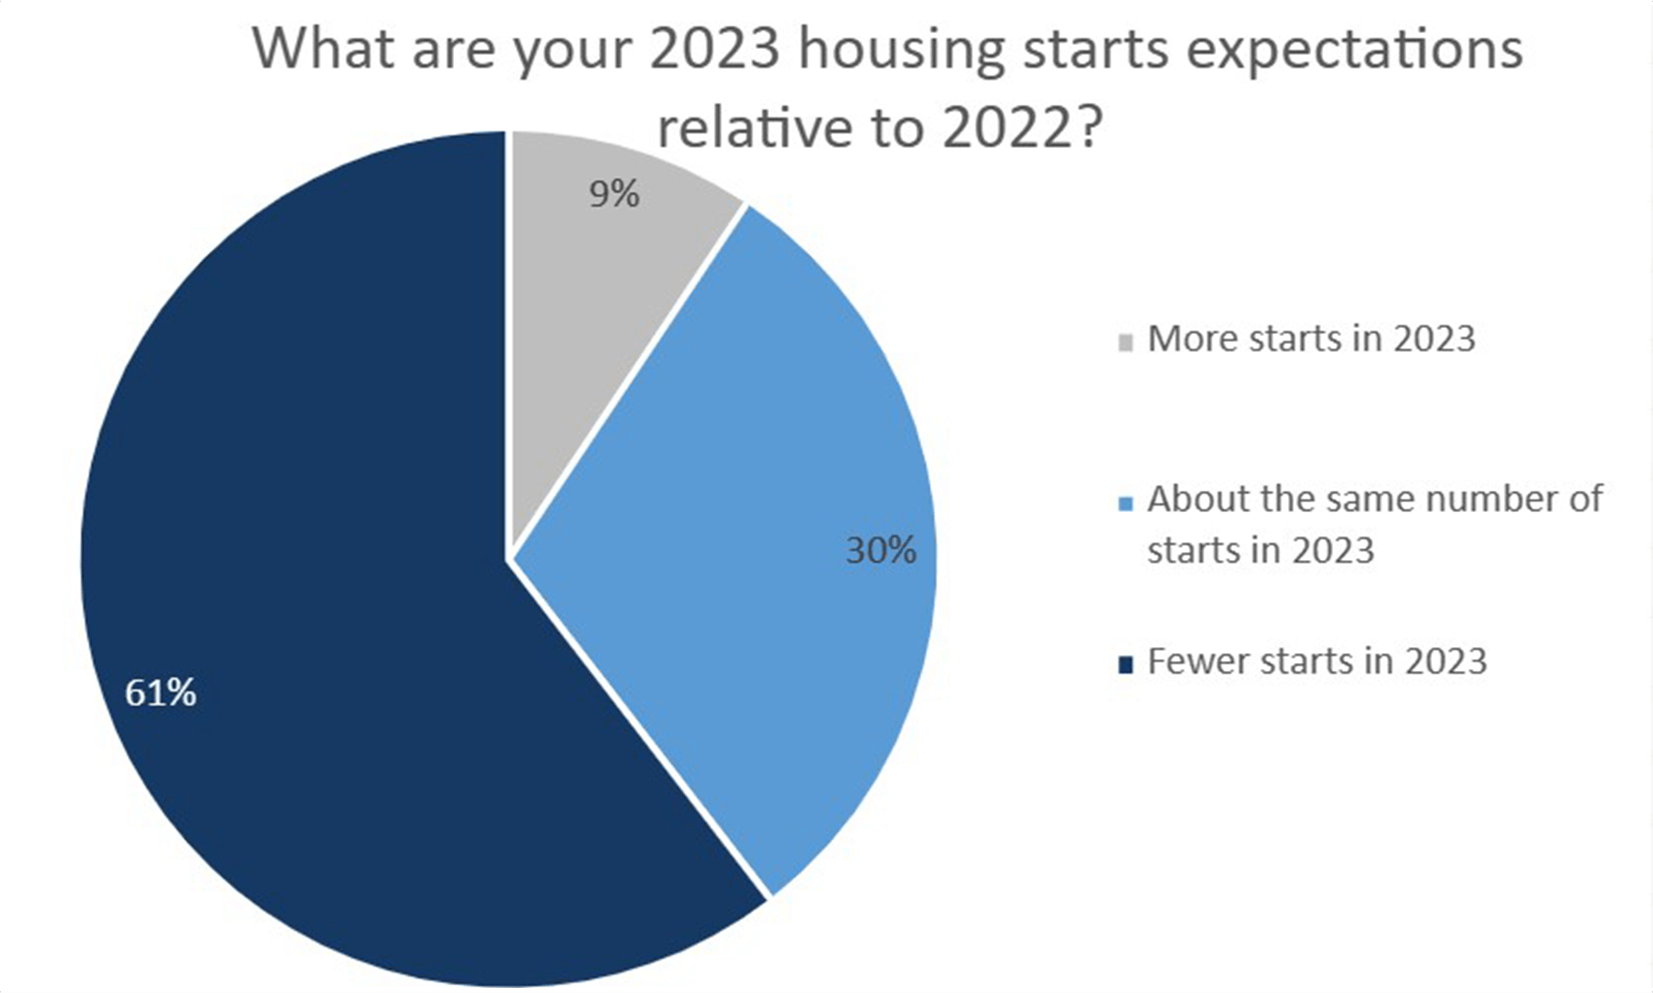
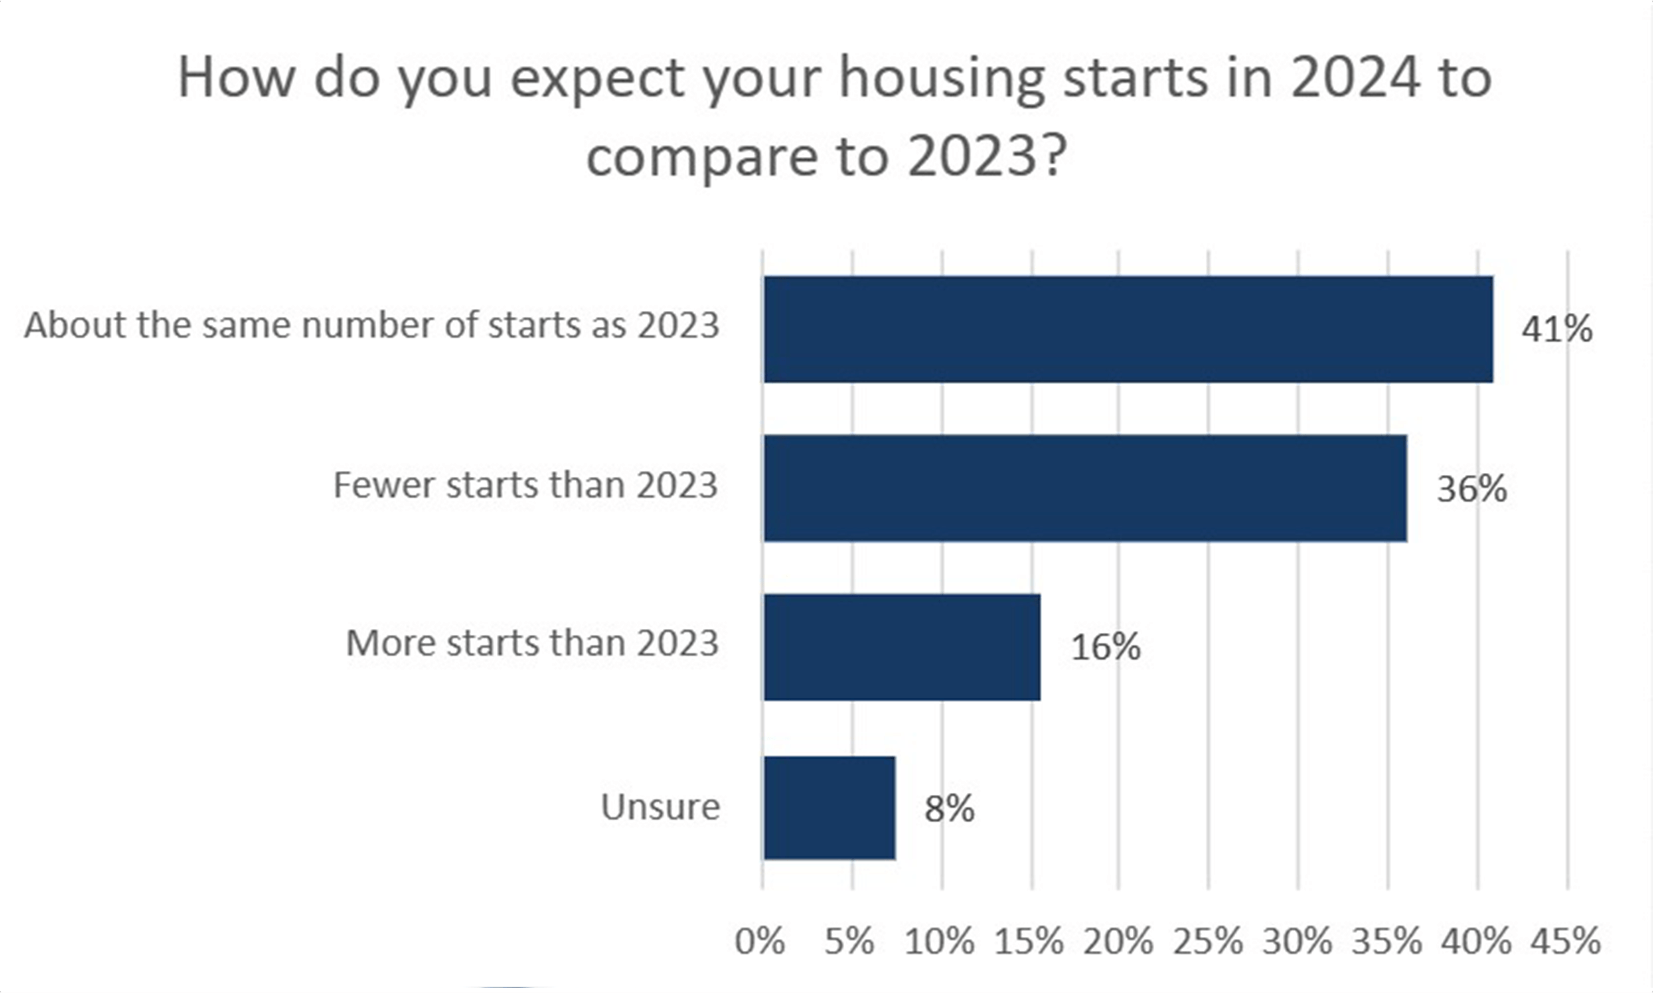
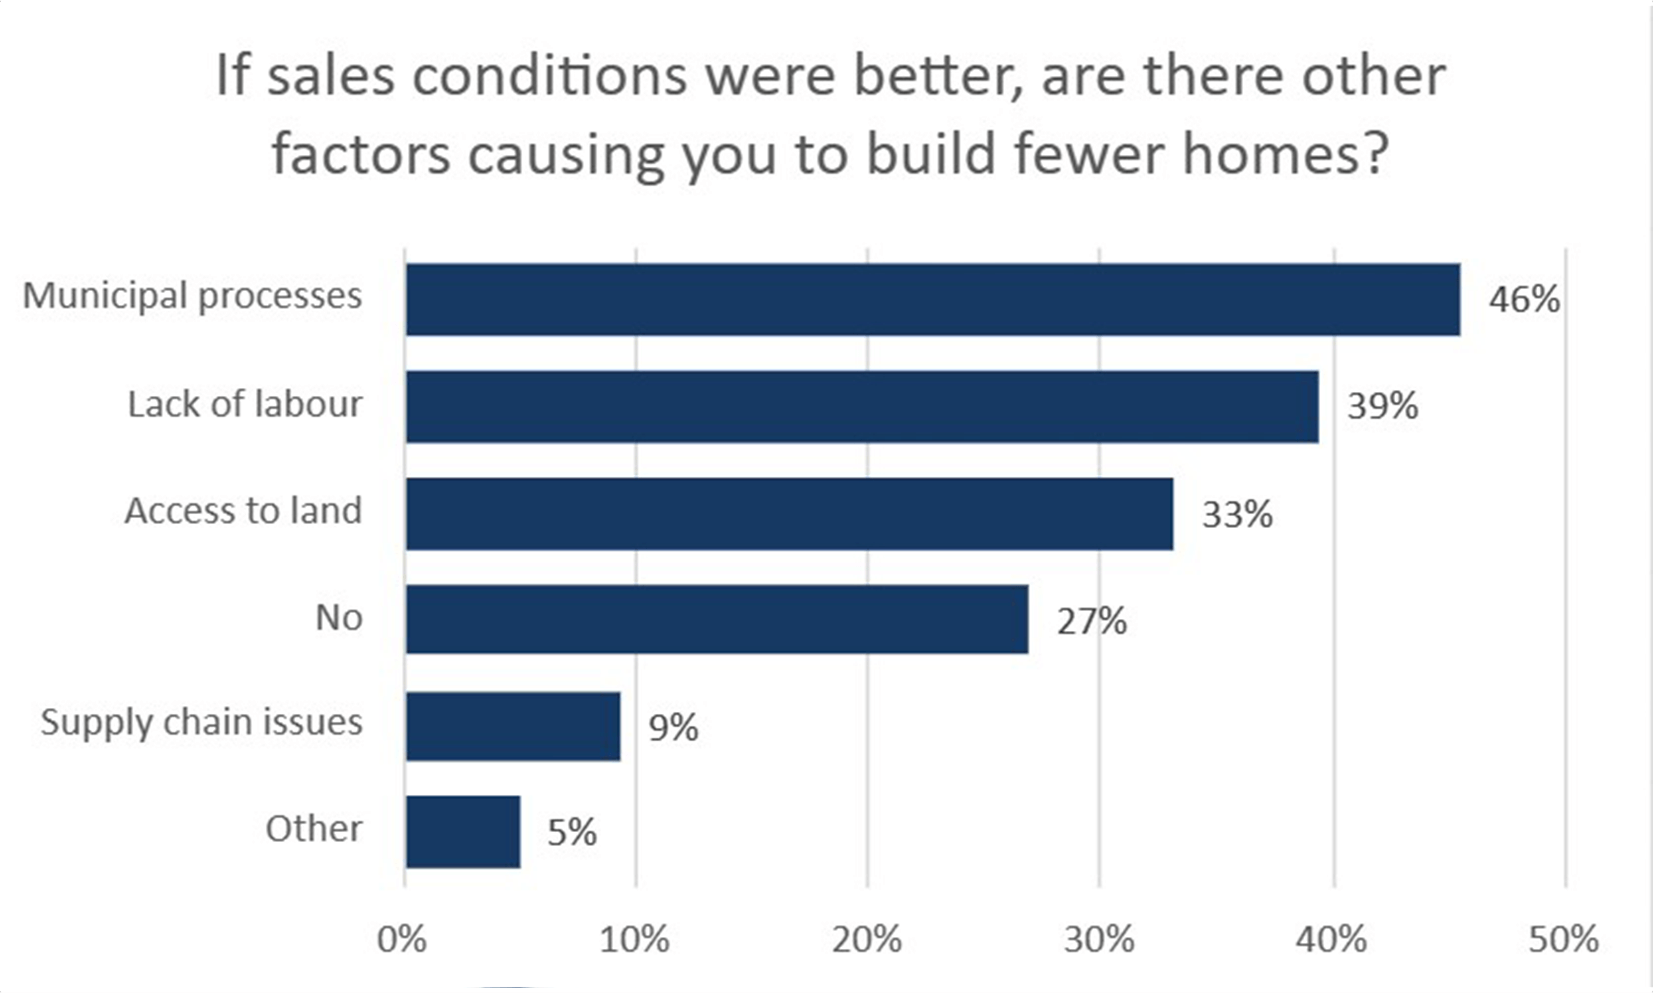
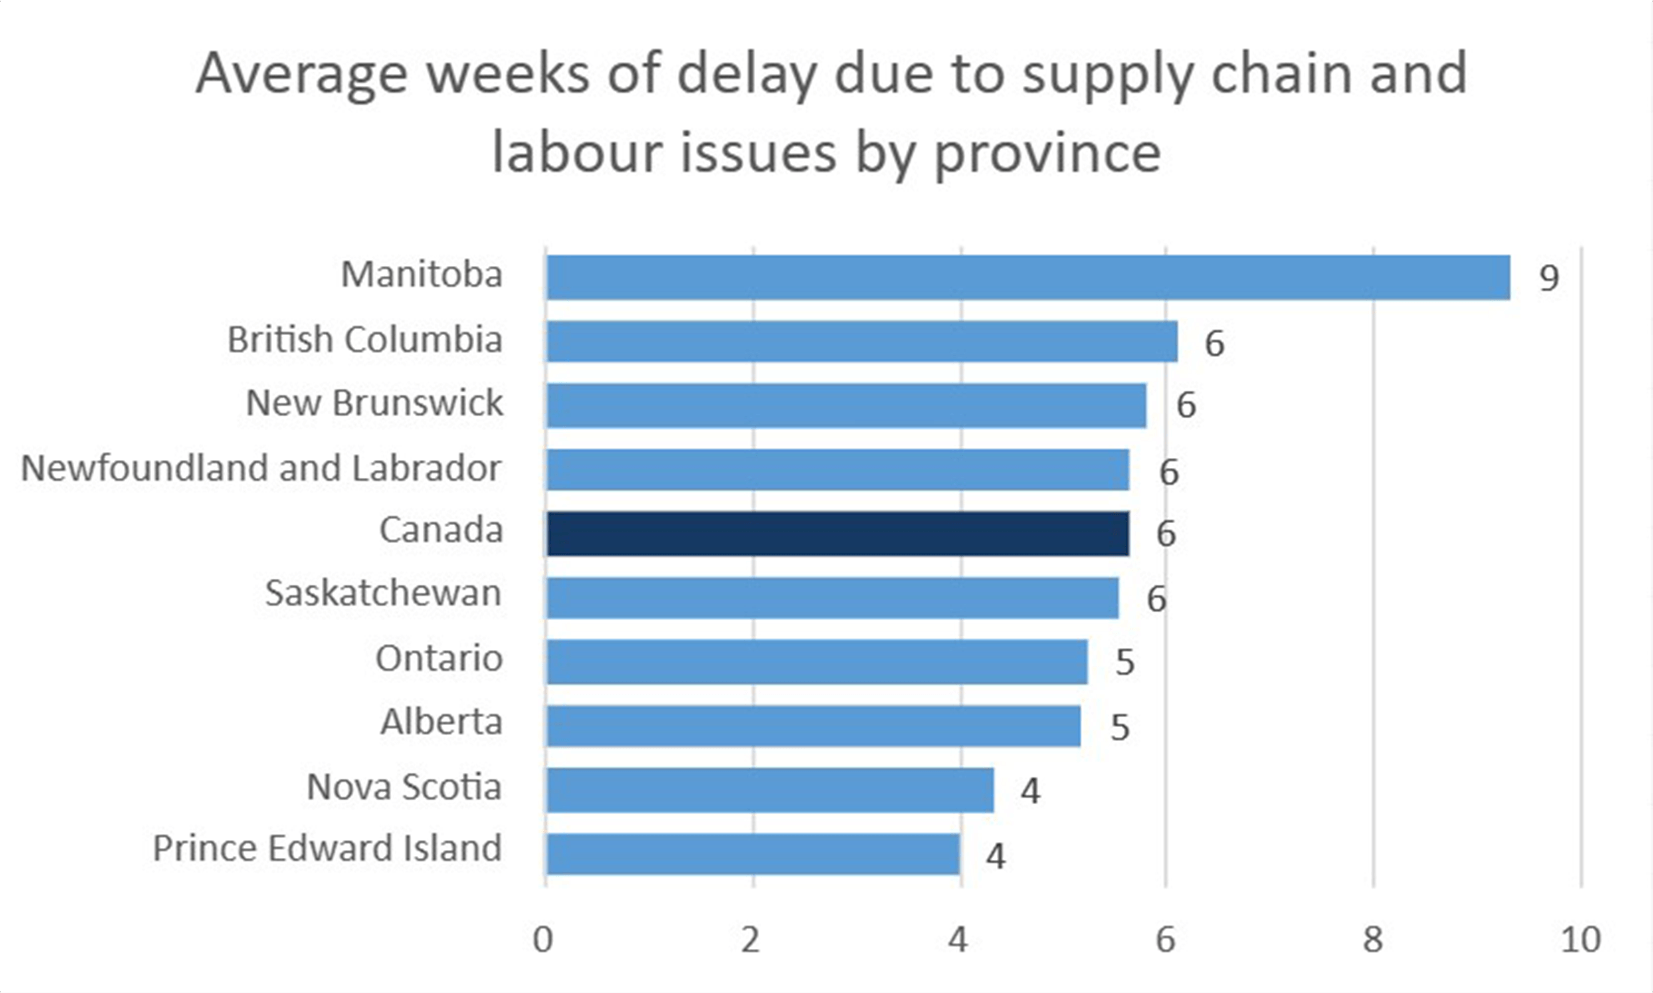
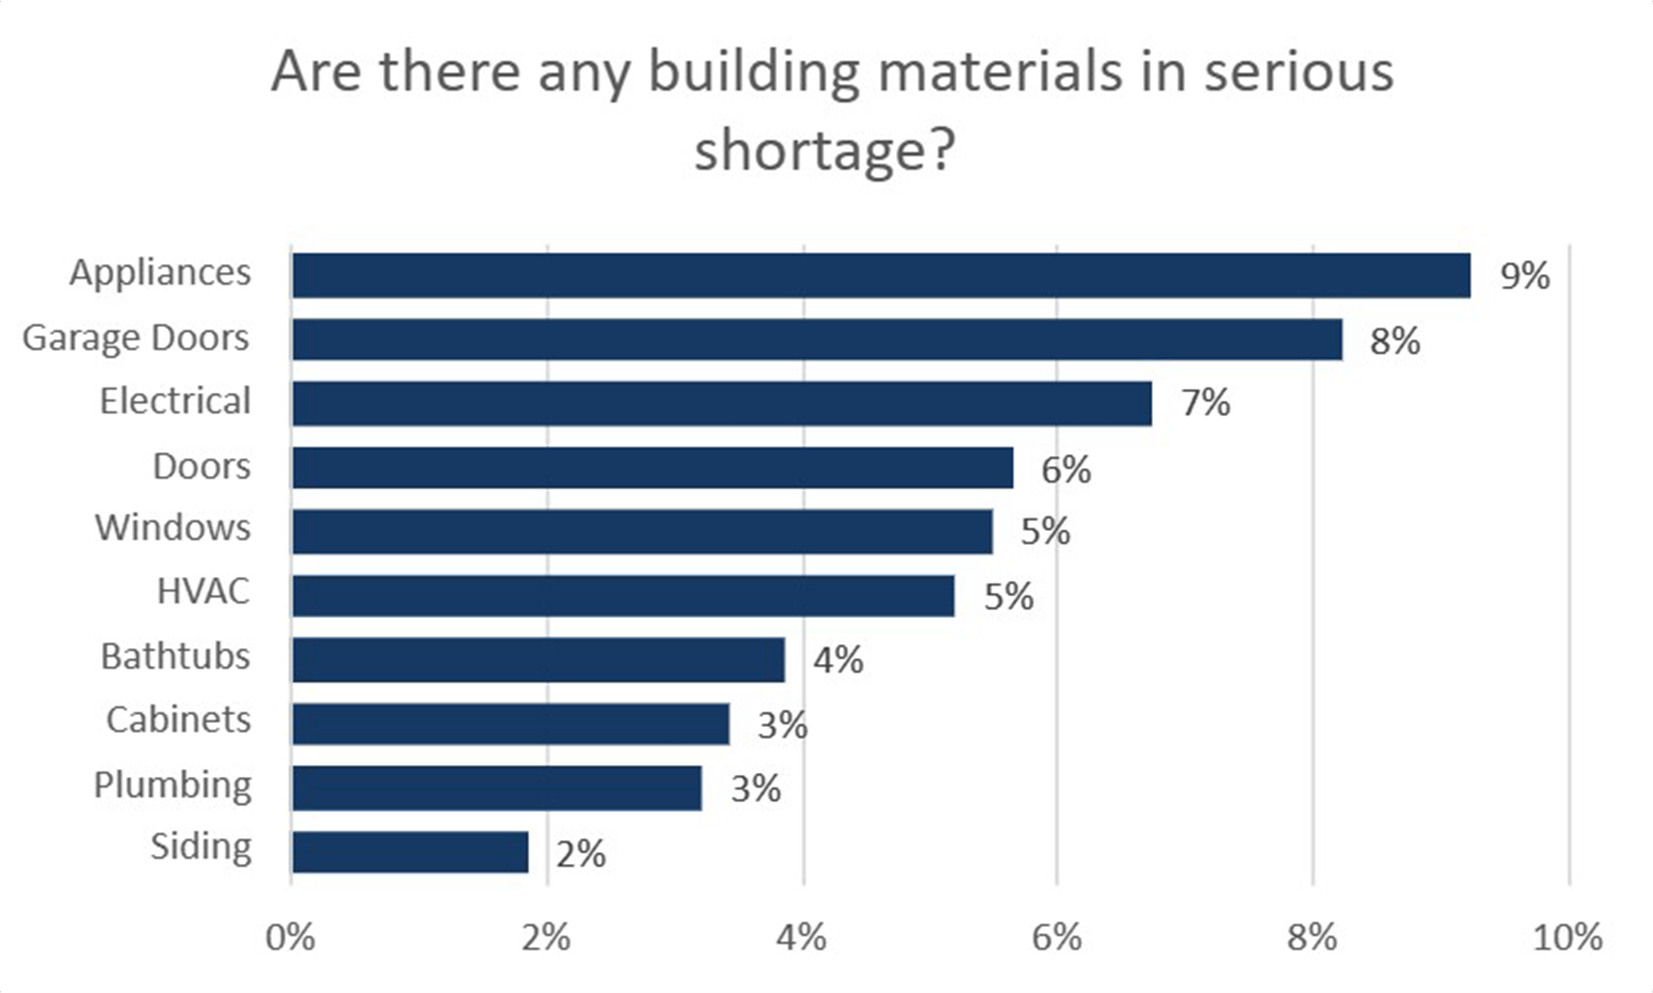
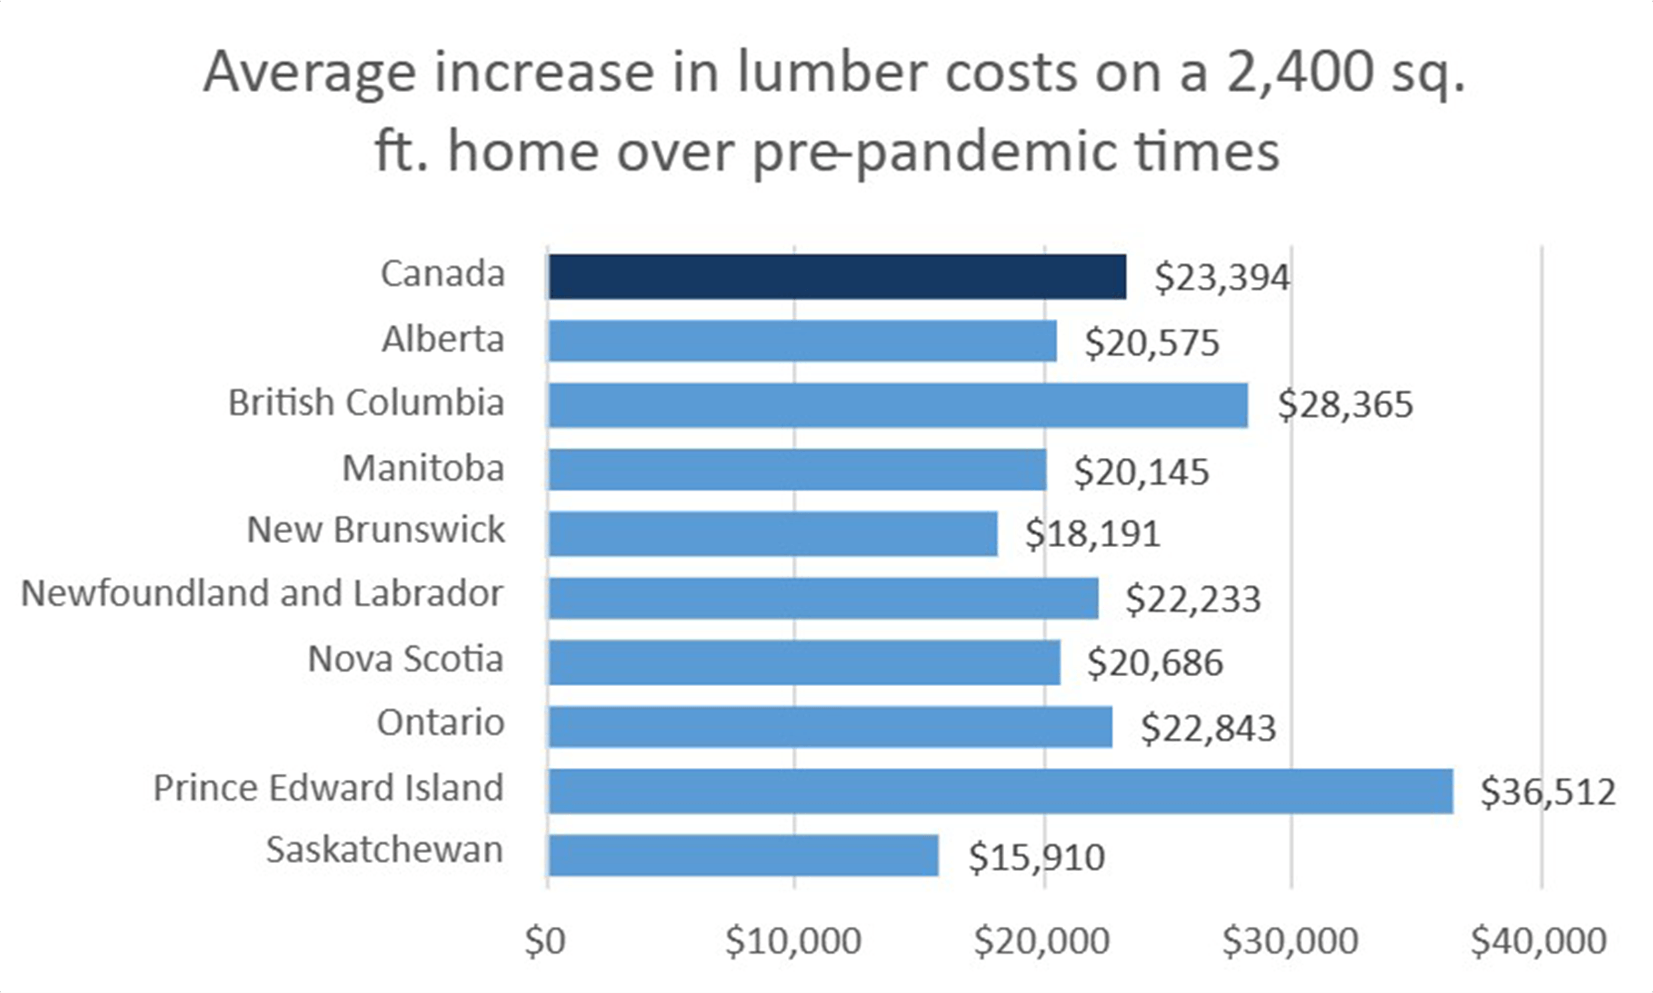
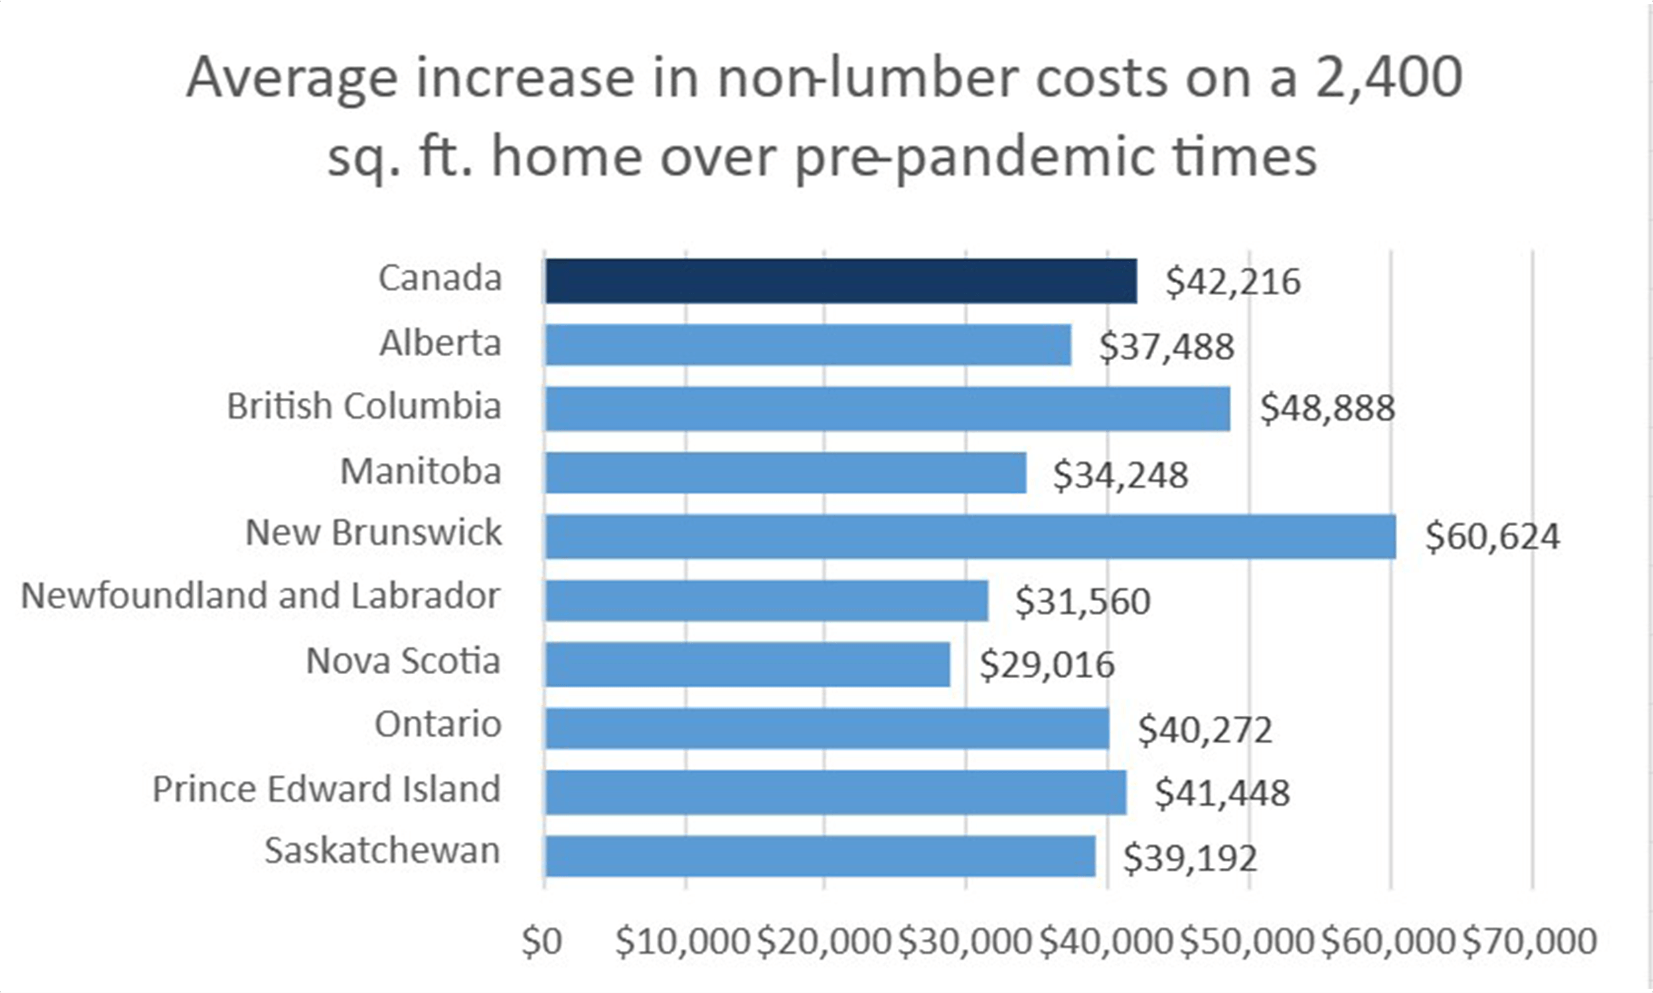
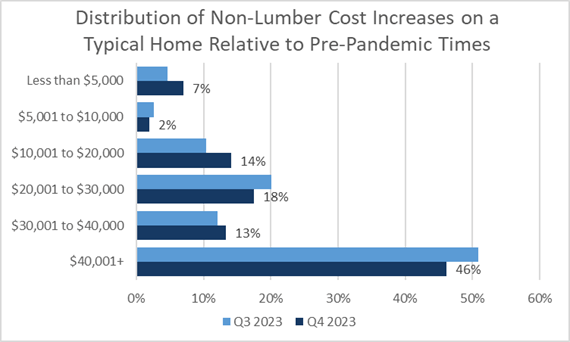
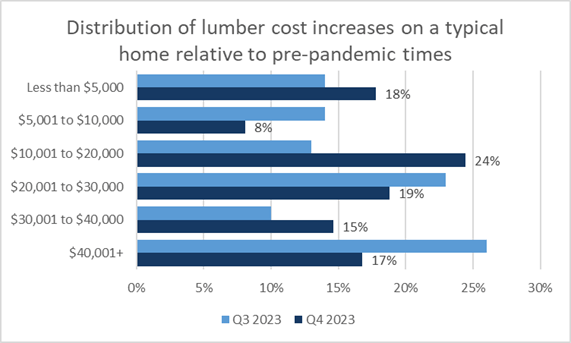
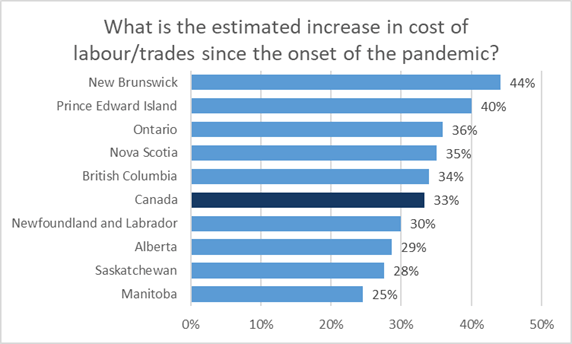
- The CHBA HMI for single-family builders fell to 33.9 in Q3 2023, 6 points lower from 39.9 recorded in Q2 2023. This is its second lowest reading on record, with data going back to 2021, and is slightly below 34.3 that was recorded in Q1 of 2023. Furthermore, the single-family HMI has reflected downbeat sentiment—below a value of 50—in five consecutive quarters. All three subindices for present selling conditions, expectations for selling conditions in the next six months, and sales traffic of prospective homebuyers deteriorated and contributed to the decline in the single-family HMI between the second and third quarter.
- Regionally, home builders in Ontario were most pessimistic. That said, the third quarter single family HMI readings in British Columbia and the Prairie Provinces also declined.
- The open-ended comments received from builders also follow similarly to sentiment readings. Given the difficulty in gaining mortgage approvals, sales office traffic remains low. Some builders noted that of the few well qualified buyers, there is buyer interest in existing inventory only.
- 47% of single-family HMI respondents rated the current selling conditions as Poor, which is 15 percentage points worse than Q2 2023. Relative to the previous quarter, the proportion of respondents that gave current selling conditions a Fair rating fell by over 17 percentage points to 30.7%.
- Compared to the national average of 48%, Ontario respondents were most likely to rate current conditions as Poor, at 70%.
- Only 7% of single-family builders rated sales office traffic of prospective homebuyers to be High or Very High. The proportion of builders selecting this rating has now remained in single digits for five consecutive quarters. 55% of respondents rated prospective traffic volume as Low or Very Low, which is an increase of 11 percentage points over the previous quarter but still below the 72% that gave this rating in Q4 2022—when the single-family HMI recorded its all-time low.
- Both the Prairie Provinces and the Atlantic Region were most likely to select an Average rating. Meanwhile, 79% of builders from Ontario rated traffic conditions as Low or Very Low.
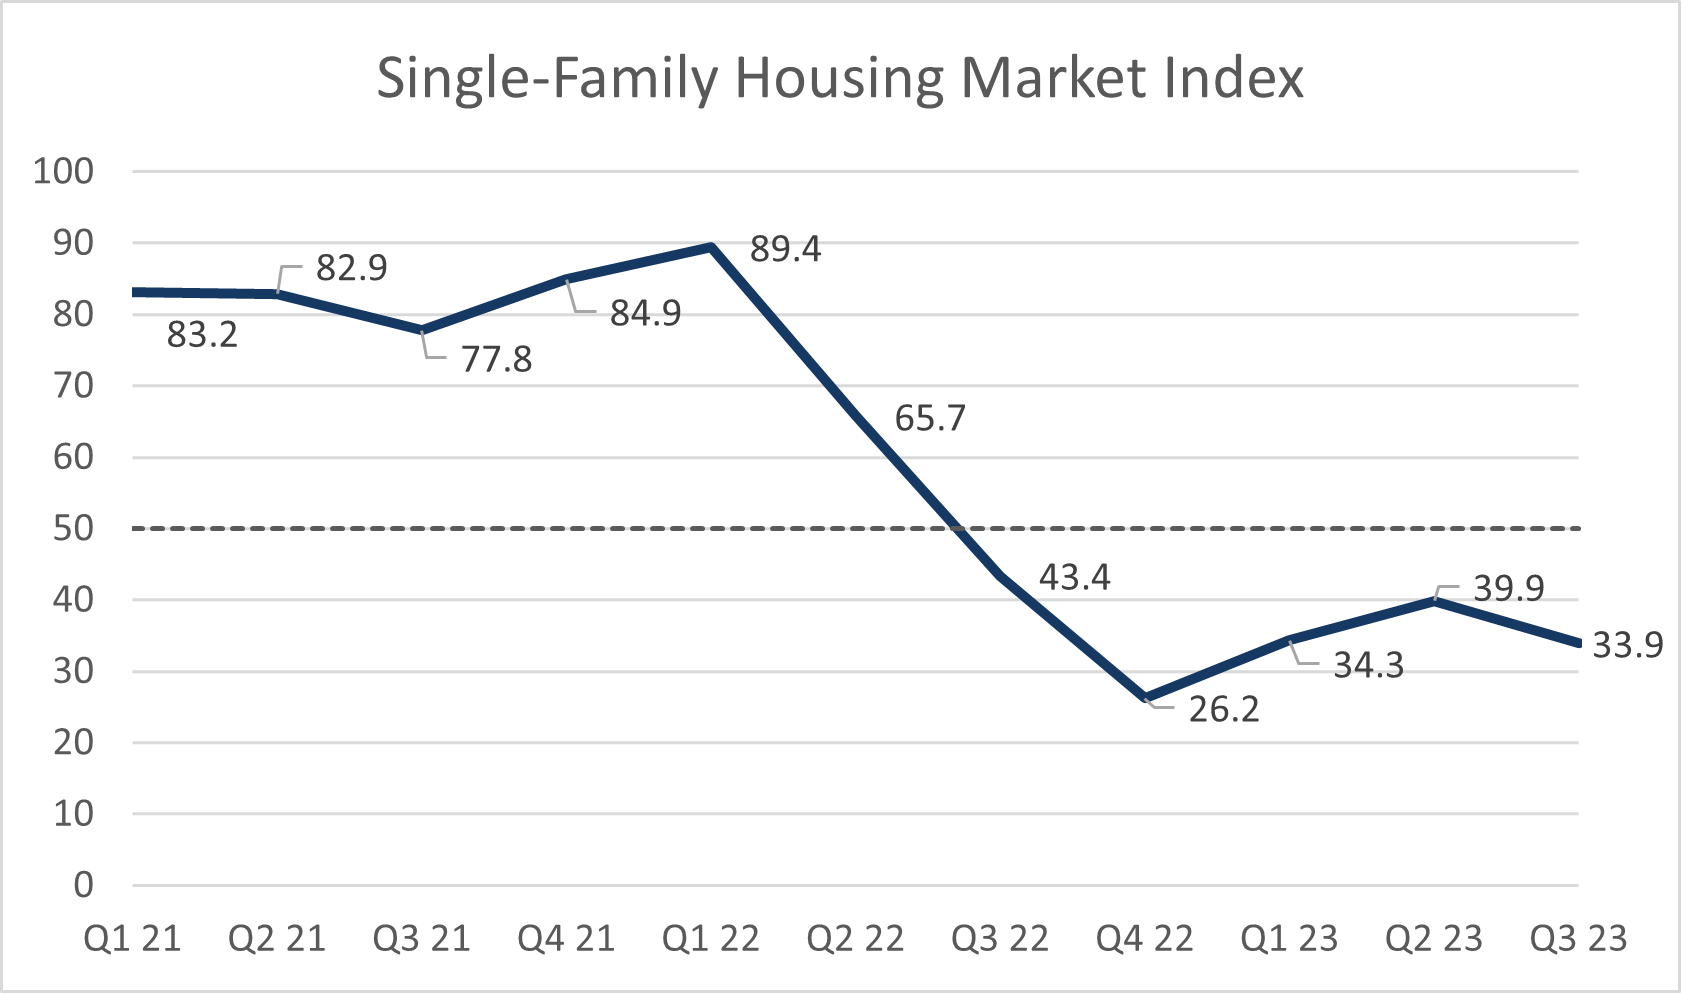
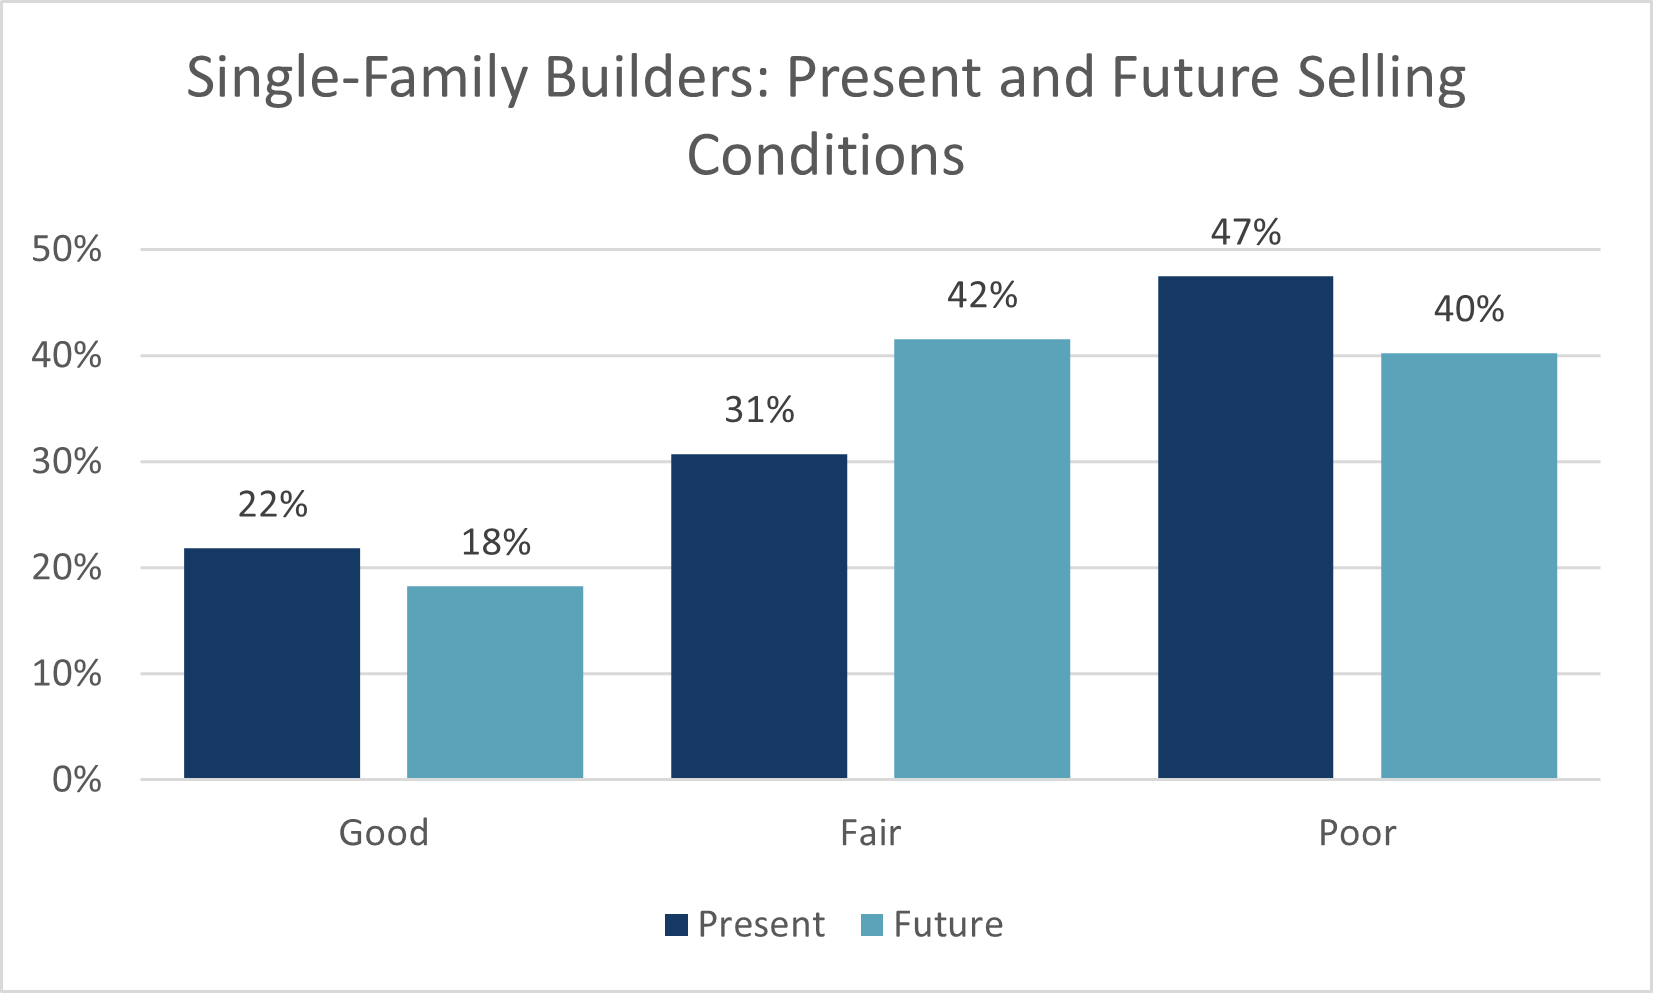
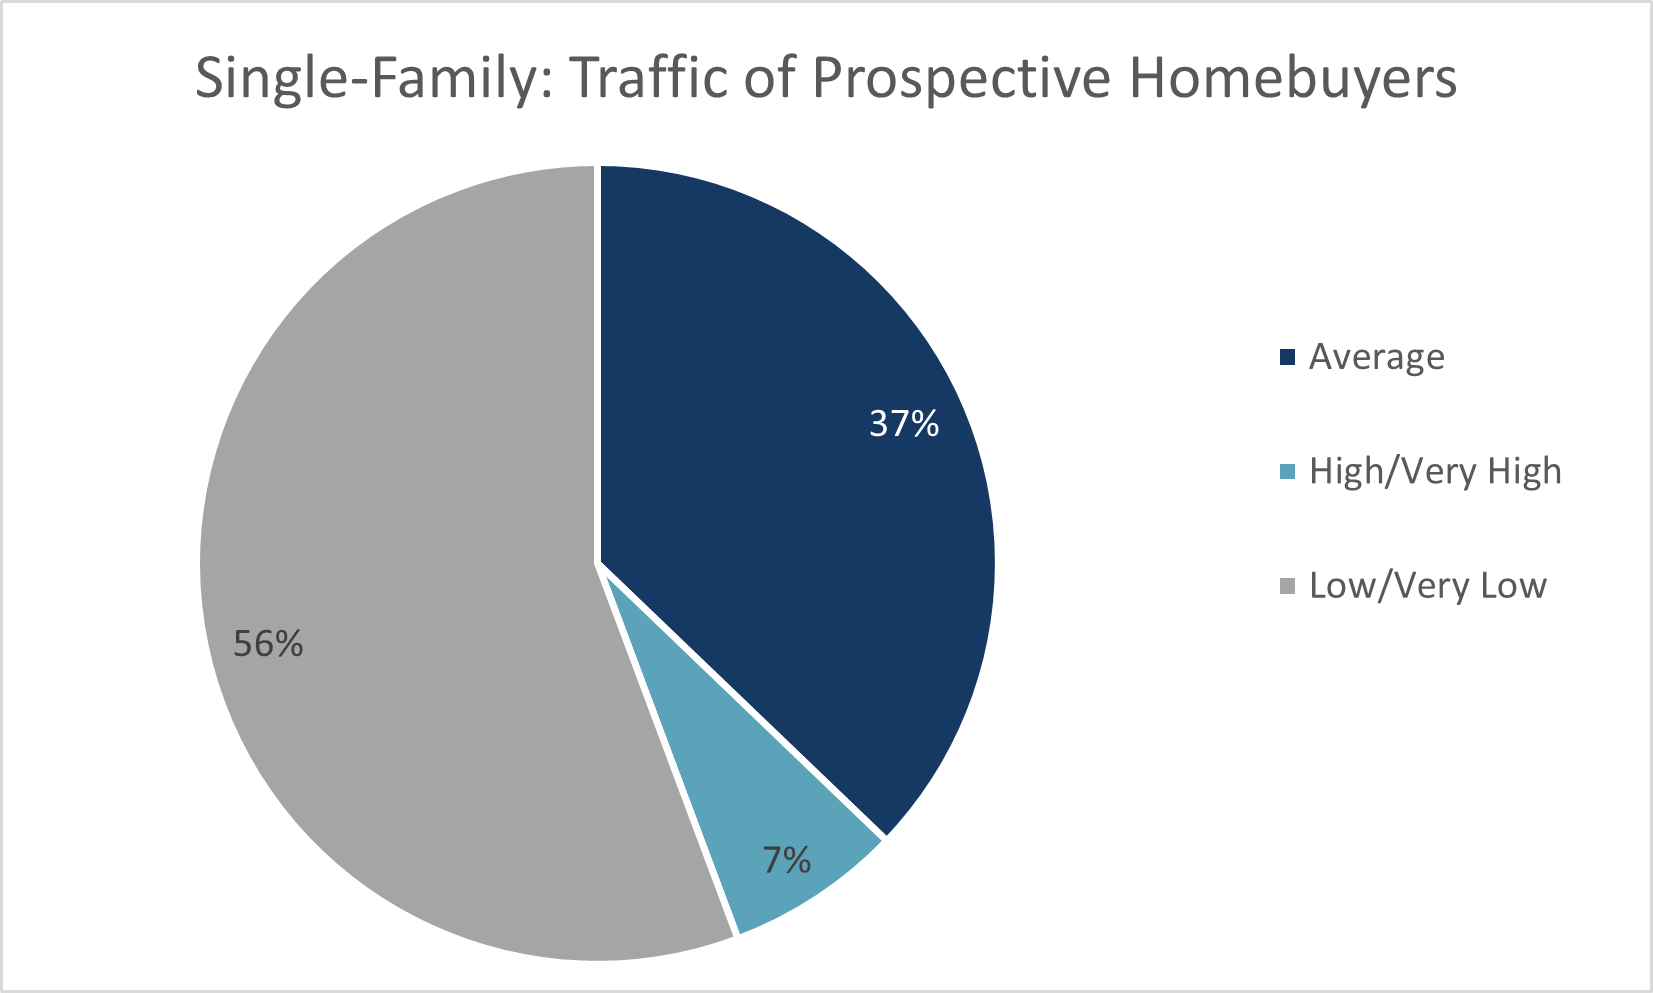
- The CHBA HMI for multi-family builders was 33.6 in Q3 2023. The index fell 7.4 points from the value of 41.0 in Q2 2023 and is closely aligned with the sentiment value of 35.9 recorded a year ago in Q3 2022. Similar to the single-family index, sentiment among multi-family builders has remained downbeat for five consecutive quarters.
- Again, the breadth of downbeat sentiment was widest among builders located in Ontario.
- Comments from strictly multi-family builders suggest prospective buyers are taking longer to make decisions and overall sales traffic volumes were particularly slow through the summer months.
- The proportions of builder ratings for present selling conditions were closely split between Fair (45%) and Poor (44%). Both these ratings saw their proportions worsening among builders over the previous quarter, as the proportion that gave a Good rating fell 12 percentage points to 12%.
- Builders from Ontario were most likely to be downbeat, with 72% rating current selling conditions as Poor, compared to the national average of 44%. Conversely, the majority respondents in the three other regions rated current selling conditions as Fair.
- The majority (56%) of multi-family builders characterized their expectations of future selling conditions as Fair; 29% of builders gave a Poor rating. On balance, builders across all regions hold slightly more neutral views about the near future relative to current selling conditions.
- A 58% majority of builders of multi-unit projects indicated that prospective buyer traffic was Average. Just one builder gave a sales office traffic rating of High or Very High—the lowest incidence recorded.
- In Ontario, 72% of multi-unit builders gave a Low or Very Low rating. However, builders in British Columbia were more neutral, with 75% giving an Average rating.
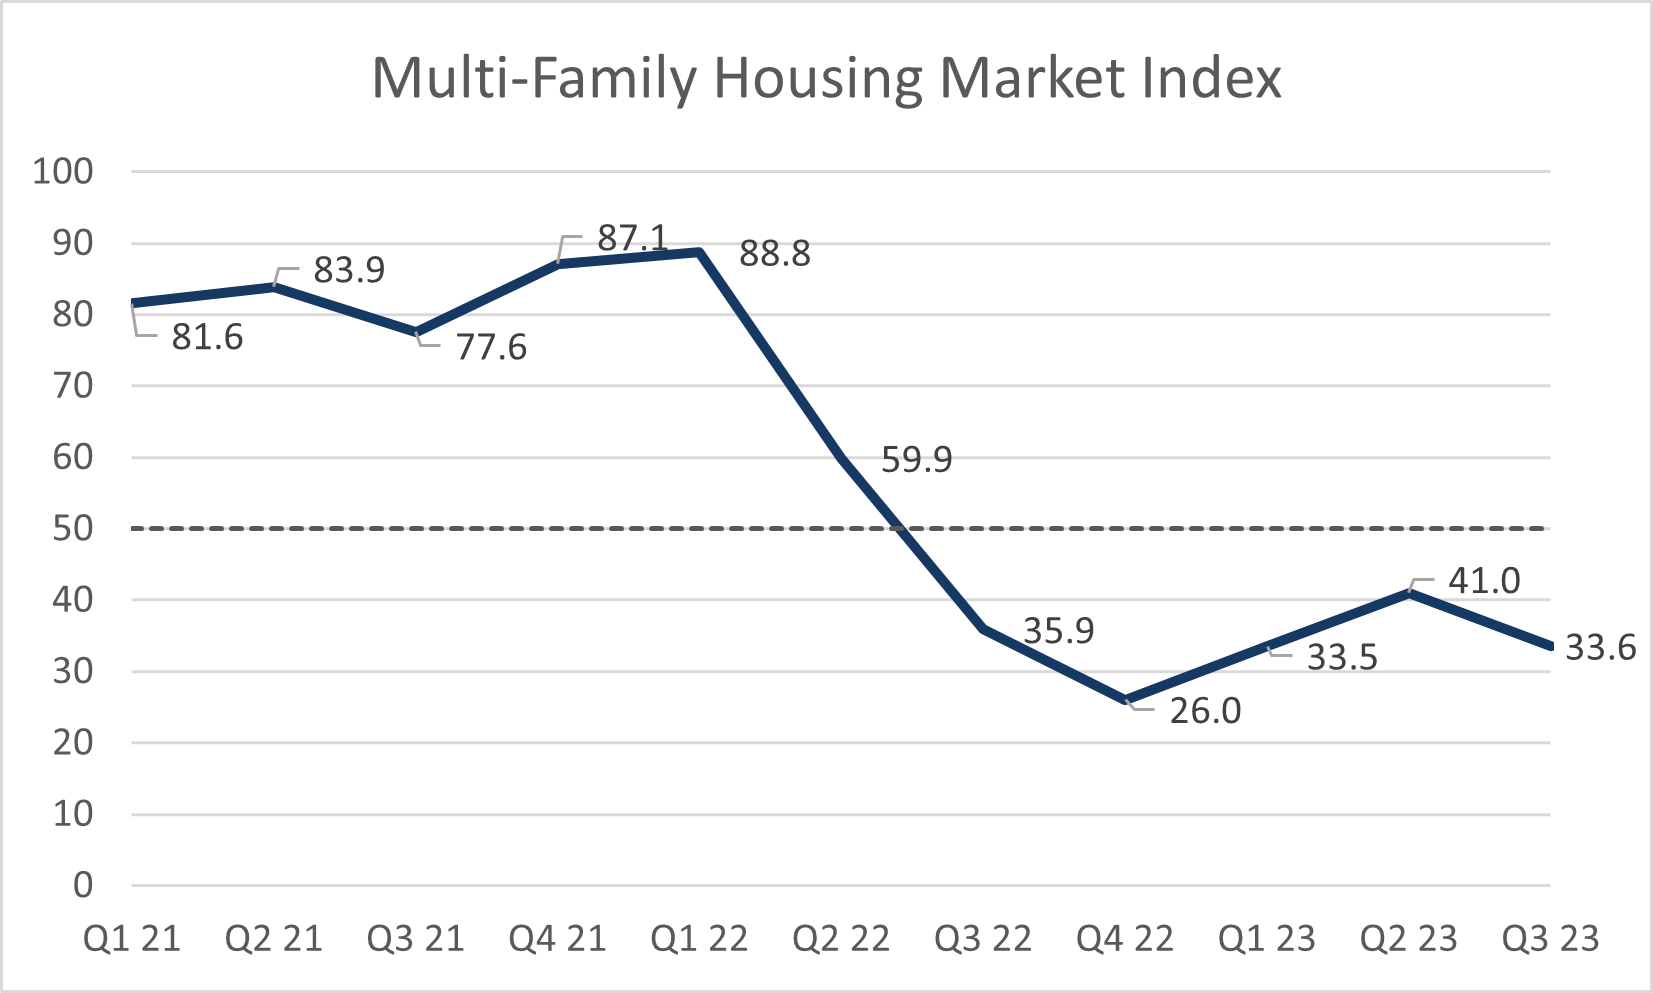
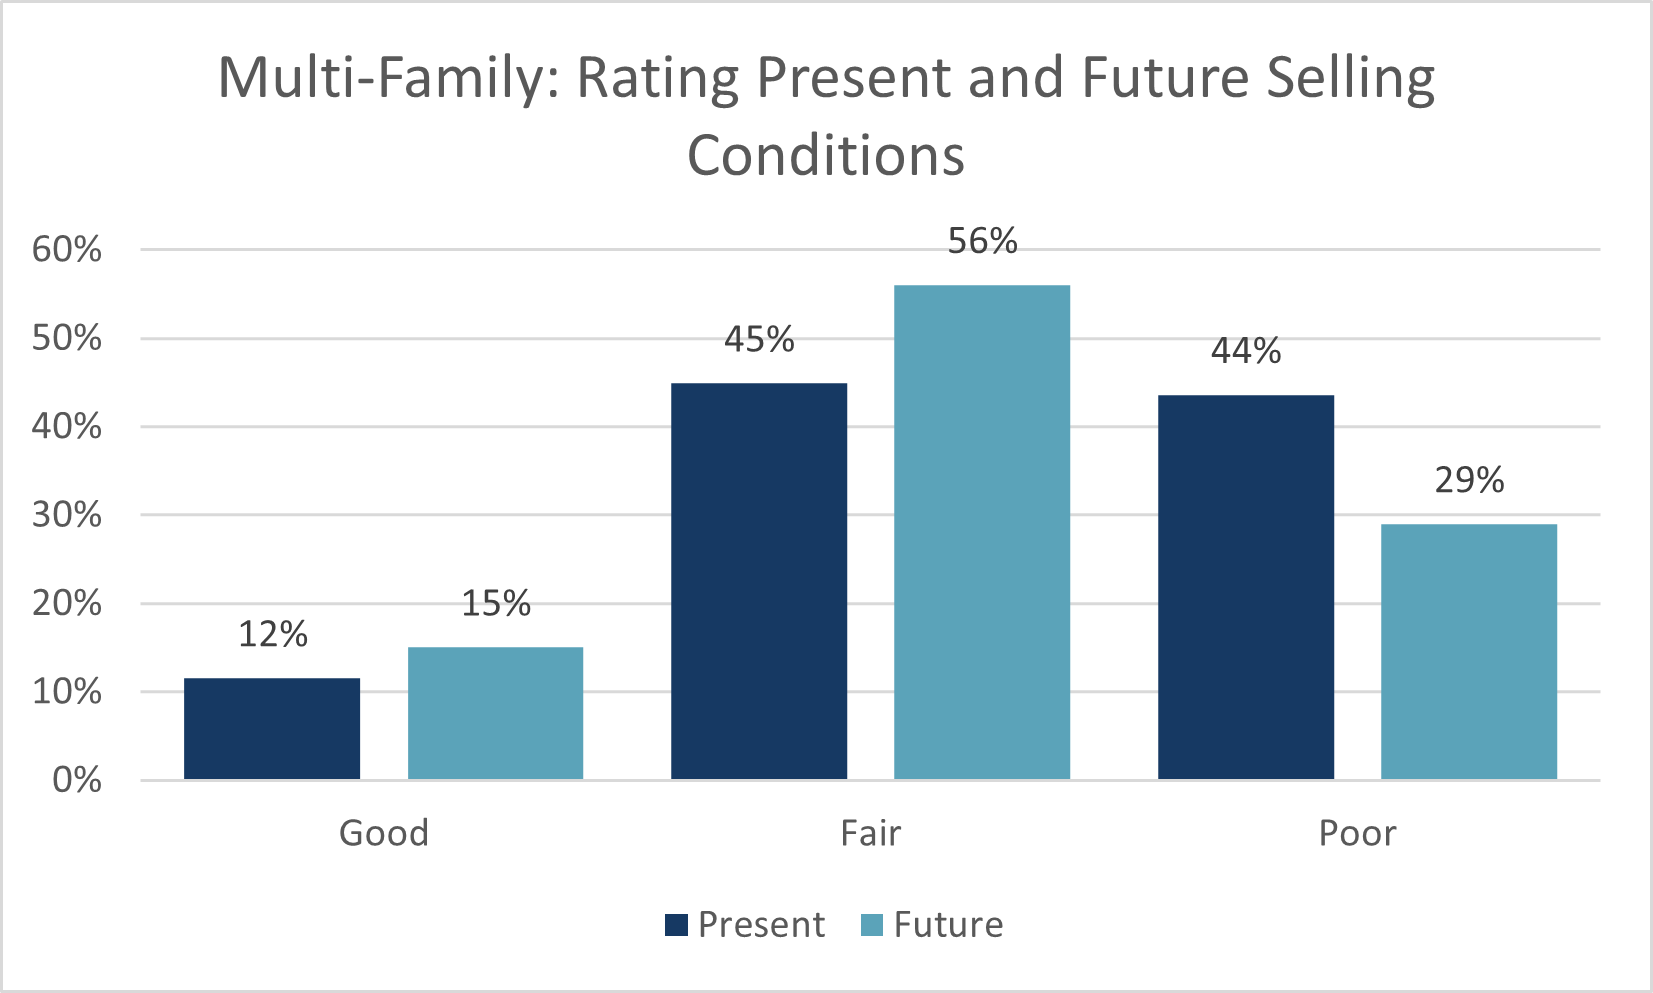
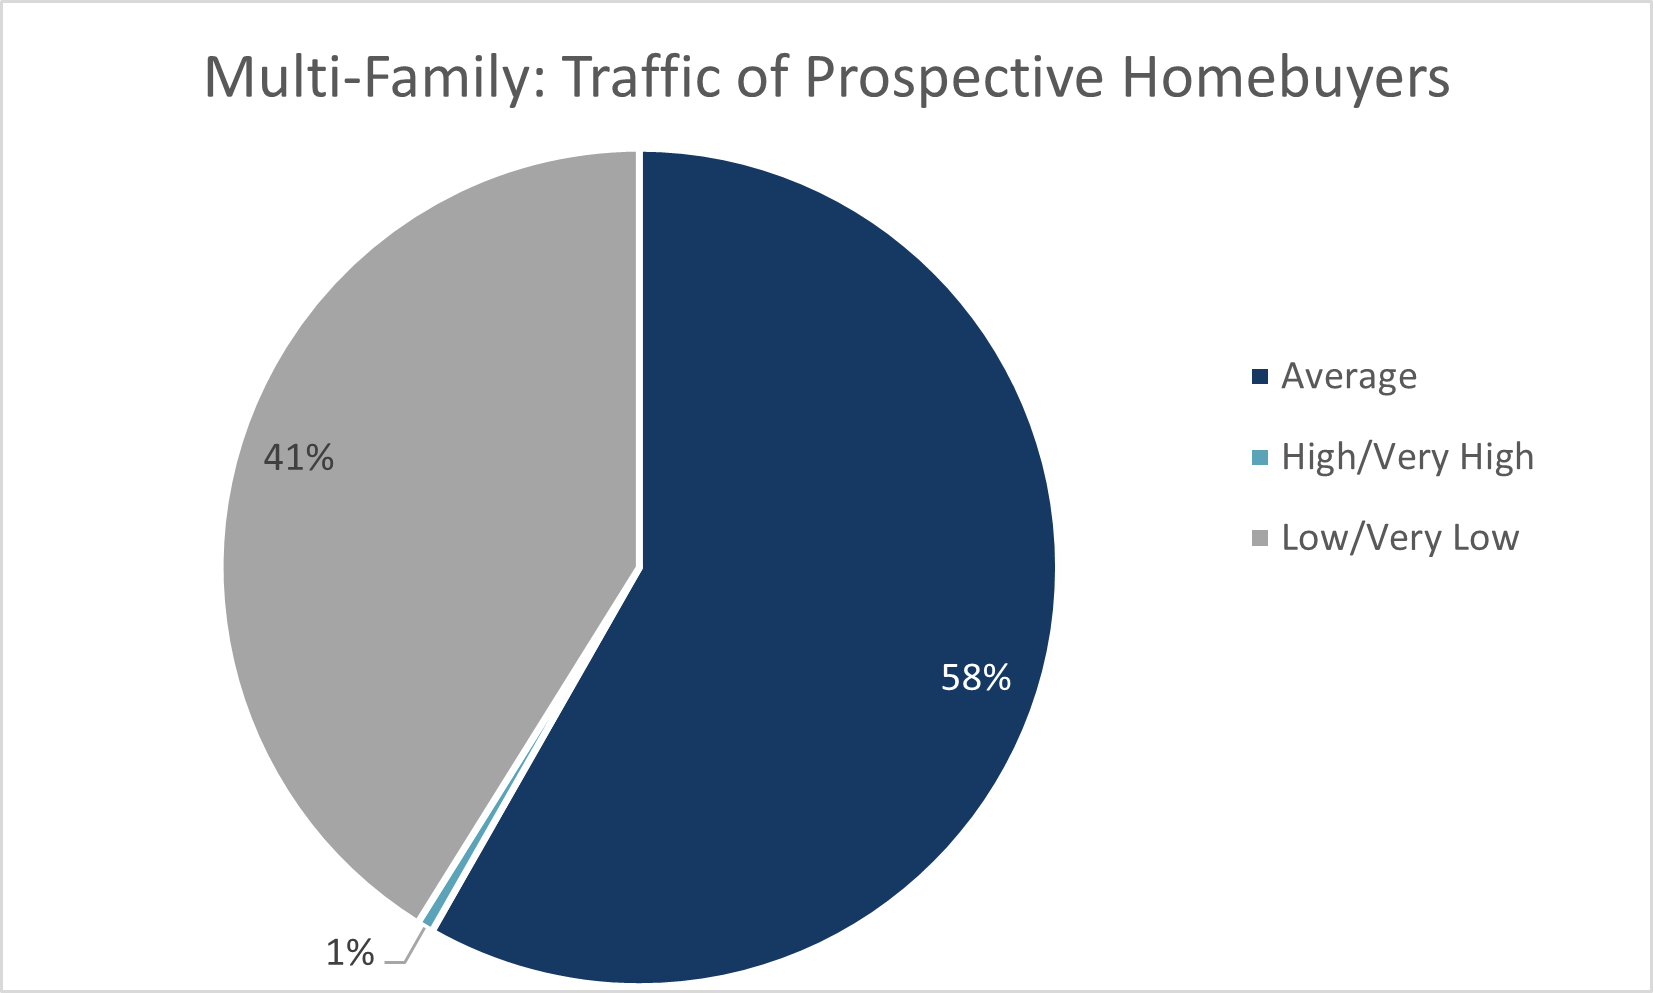
In addition to the survey questions directly used to calculate the HMI, CHBA includes additional “special questions” to ask the expert panel. These special questions allow CHBA to better understand what is driving change in builder sentiment and gain insights into current industry issues. The following are some of the findings from the special questions in the Q3 2023 survey:
- When asked about the impact of the cumulative increases to the Bank of Canada’s policy rate, the builders’ most common answer (40%) was that sales traffic is down and has not shown any signs of recovery. The proportion of builders stating that sales traffic was starting to return fell 11 percentage points from the previous quarter, down to 28%. Meanwhile, those reporting that sales traffic flow has gotten worse fell 9 percentage points over the Q2 2023, and is now at 21%.
- Builders were asked a follow up question about the impact of the policy rate increases in June and July on sales traffic. 39% of builders reported that these announced rate increases put an end to the springtime recovery in sales office traffic. 29% reported that sales traffic slowed even more—beyond their already low foot traffic.
- With high interest rates reducing demand from qualified buyers and reducing builders’ access to capital, builders were asked if they have had scale back their projects or cancel them completely. 65% of the survey panel stated that interest rates are causing them to build fewer units. Most concerning was the 37% of panelists that stated they have canceled projects as a result—up from 26% of panelists in Q2 2023.
- Corresponding with the retrenchment in both HMI readings, there was an increase of 11 percentage points over the previous quarter, to 44%, in the proportion of builders reporting that they are concerned or extremely concerned about the future for their business.
- Builders were asked to state their difficulties and level of concern surrounding closings of previous sales. 41% of panelists stated that their buyers are having to seek alternative lending solutions, down from 49% in the previous quarter. However, 32% of builders stated that distressed buyers are causing concern about their business, up from 27% in Q2 2023.
- When asked to compare their expectations for their 2023 housing starts relative to 2022, 68% of the panel stated they expect to have fewer starts this year, while just 6% stated they expect to have more starts this year than they did in 2022.
- Out of the subset of builders that expected to have fewer housing starts this year, the unweighted average percent decline was 47%— this is slightly more than the 40% average reported in the previous quarter.
- Builders were asked about their expectations for starts in 2024, which often depends on demand and conditions in the years prior. 37% of builders stated they expect to build about the same number as they will this year. Closely behind, 35% reported that they expect to start fewer homes next year.
- Comments from builders highlighted their uncertainty surrounding their expectations. Builders cited the interest rates environment as the overwhelming factor influencing their expectations of housing starts in 2024. Some builders noted that their starts will depend on presale performance, which they are not optimistic about.
- Builders were asked to select any of the most pressing factors, other than interest rates, that are causing them to build fewer homes. The question was also asked again in a hypothetical situation where interest rates and general sales conditions were better. In both instances, over half of builders reported municipal processes as a factor that is reducing their housing starts. The second most widespread factor was a lack of labour.
- Some builder comments pointed to their own cost of borrowing as a limiting factor. This issue has compounded the problem of rising construction costs and has hindered their ability to begin new projects.
- Asking about supply chain issues, builder comments suggest that supply chain issues for most supplies have improved. Yet only 12% stated that they are experiencing no delays.
- As with previous quarters, the building supplies with the highest incidence of being in serious shortage remain garage doors (13%) and appliances (11%). However, the proportion of builders reporting the shortage of these supplies as serious has shrunk from last quarter.
- Builders across the entire sample stated that supply chain or labour shortage challenges are delaying their home completions by an average of 7 weeks—the same as last quarter. 9% of builders stated they are not experiencing any delays. With supply chains issues unwinding, 31% reported construction delays of less than 4 weeks. This experience is not uniform across builders as 26% reported delays that are longer than 9 weeks.
- CHBA continued with a question posed last quarter asking about any changes to headcounts—either their own employees or their subcontractors. 42% of builders reported that they had not needed to lay off any workers and this was the most common answer—44% gave this answer last quarter. However, relative to the last quarter, there was a higher proportion of builders that reported they laid off workers without plans to rehire and a smaller proportion stating they hired more workers. According to the Labour Force Survey, the overall construction sector lost shed 58,000 in June and July and partially rebounded by 33,800 in August.
- CHBA continues to monitor factors that are adding to the cost of construction across the country. When asked to characterize their current experience with trades, 59% of builder stated trade prices are up. This was the most common answer and in line with its response rate from Q2 2023. However, this is below the 84% of builders that gave the same answer in Q3 of last year. Other common answers were that access to trades is difficult (46%) and access to trades is causing delays (40%). In both cases, these response rates were slightly above what was reported in Q2 2023 but again — less widespread than in Q3 2022.
- Nationwide, average trades wage growth since before the pandemic is 28%. This is the same average growth rate reported in both Q2 2023 and Q3 2022. Within the answers to the previous survey question, 25% of builders reported that trade prices are stable, the same proportion as last quarter.
- The cost of lumber is a significant contributor to the rise in the cost of construction relative to just prior to the pandemic. Over this time, lumber currently adds an average of $26,600 to the cost of a 2400 square foot home. 26% of builders estimated it has added over $40,000 to the units they typically build.
- Non-lumber material price increases since the onset of the pandemic continue to be both prevalent and significant. On average, non-lumber material prices have added over $45,500 to the cost of a 2400 square foot home. This average increase has relatively remained consistent since Q2 2022. Furthermore, a 51% majority of builders estimated these costs have risen by over $40,000 on their typical build.
- To support CHBA’s work in building sciences and codes, builders were asked about their approach to satisfying building energy codes. 66% of builders stated they use the performance path and 29% stated they use the prescriptive path. Performance path was the more common approach even when sorting responses by builder size. Provincially, this split was driven by the performance path approach being popular among builders in western provinces. However, out of builders in and east of Manitoba, 44% stated they use the performance path and 48% use the prescriptive path.
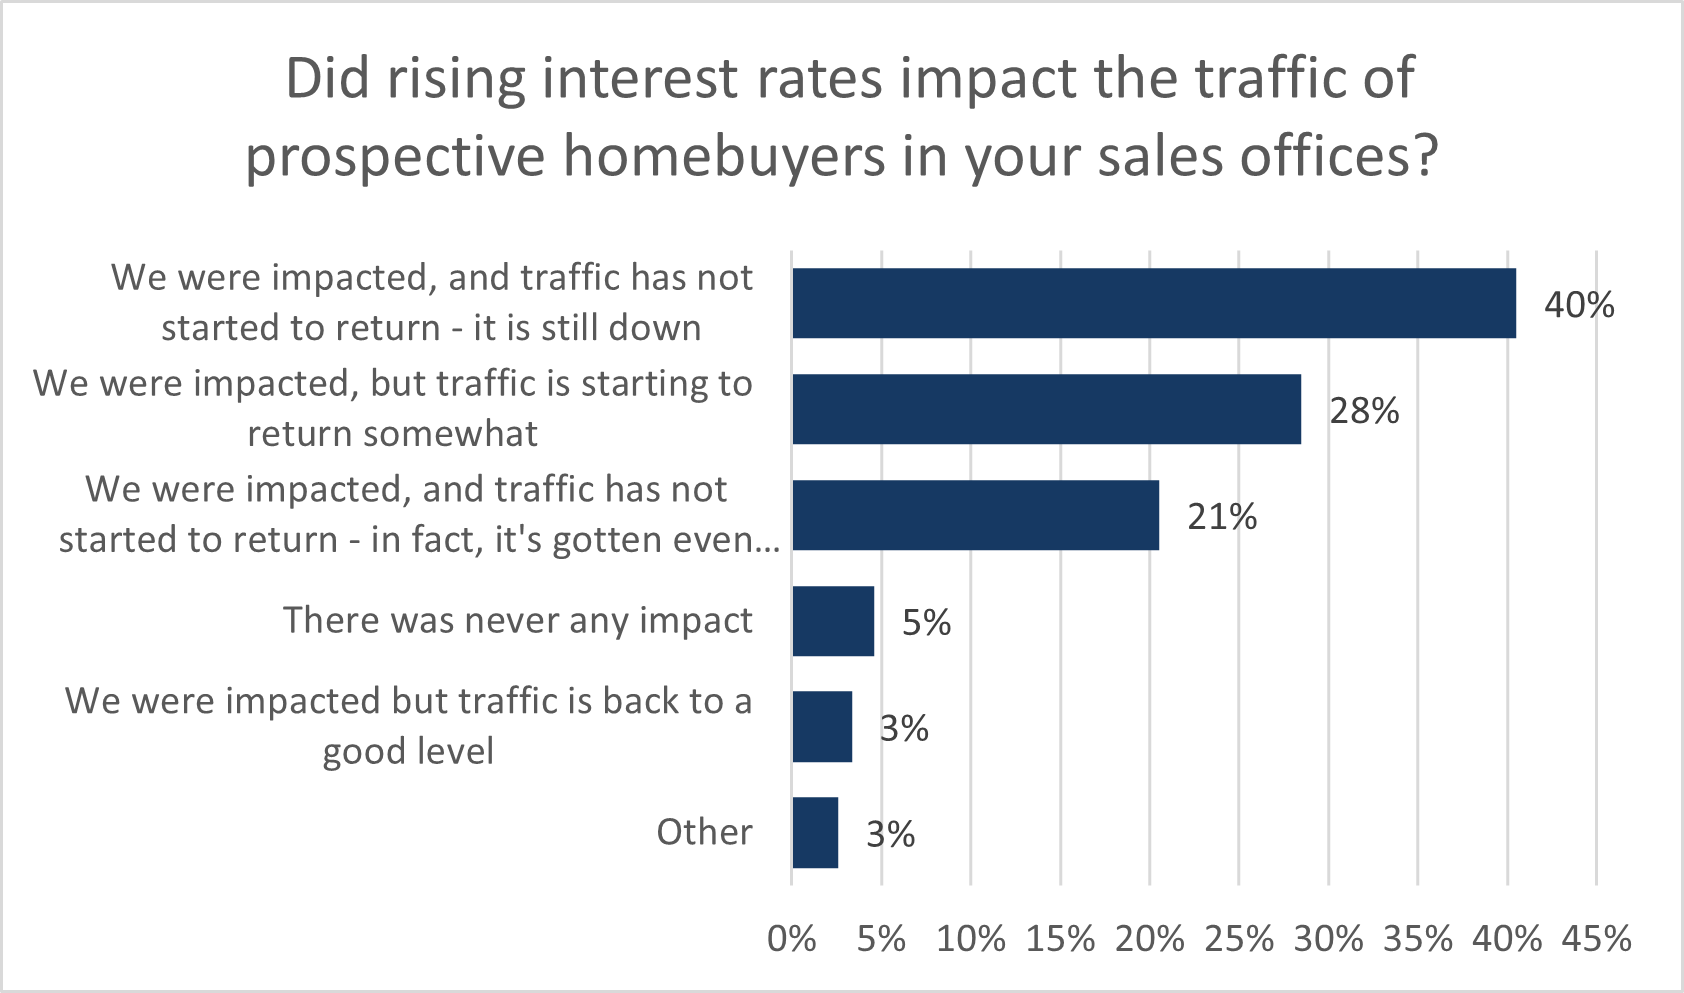

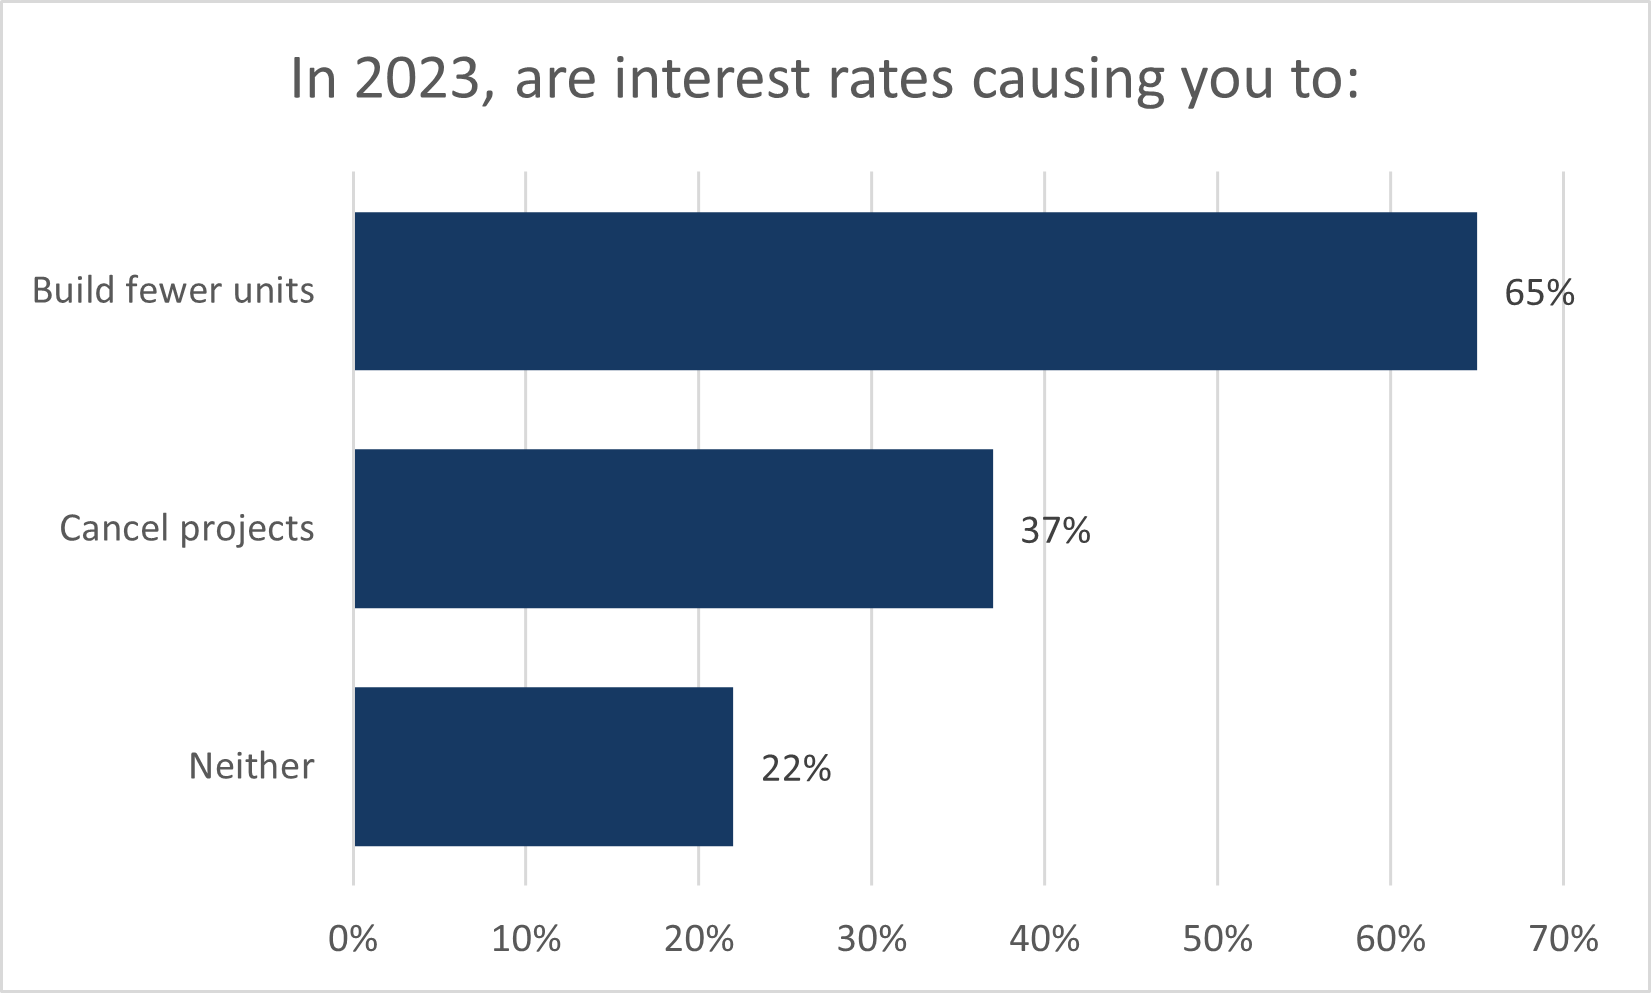
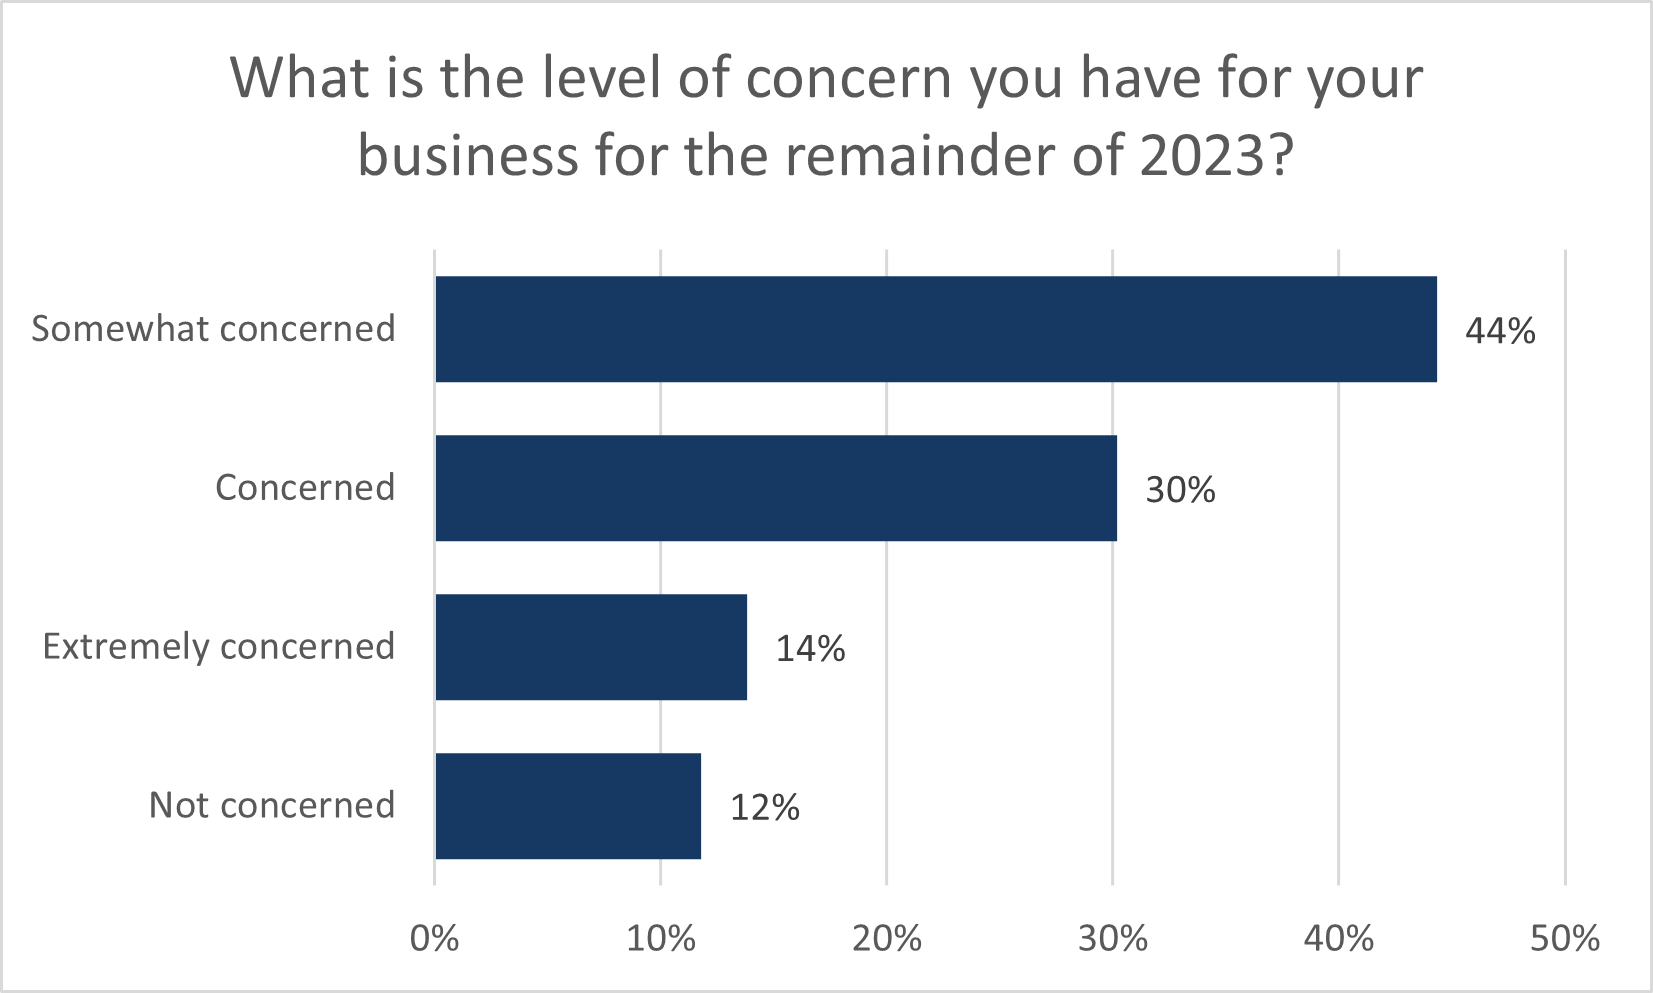
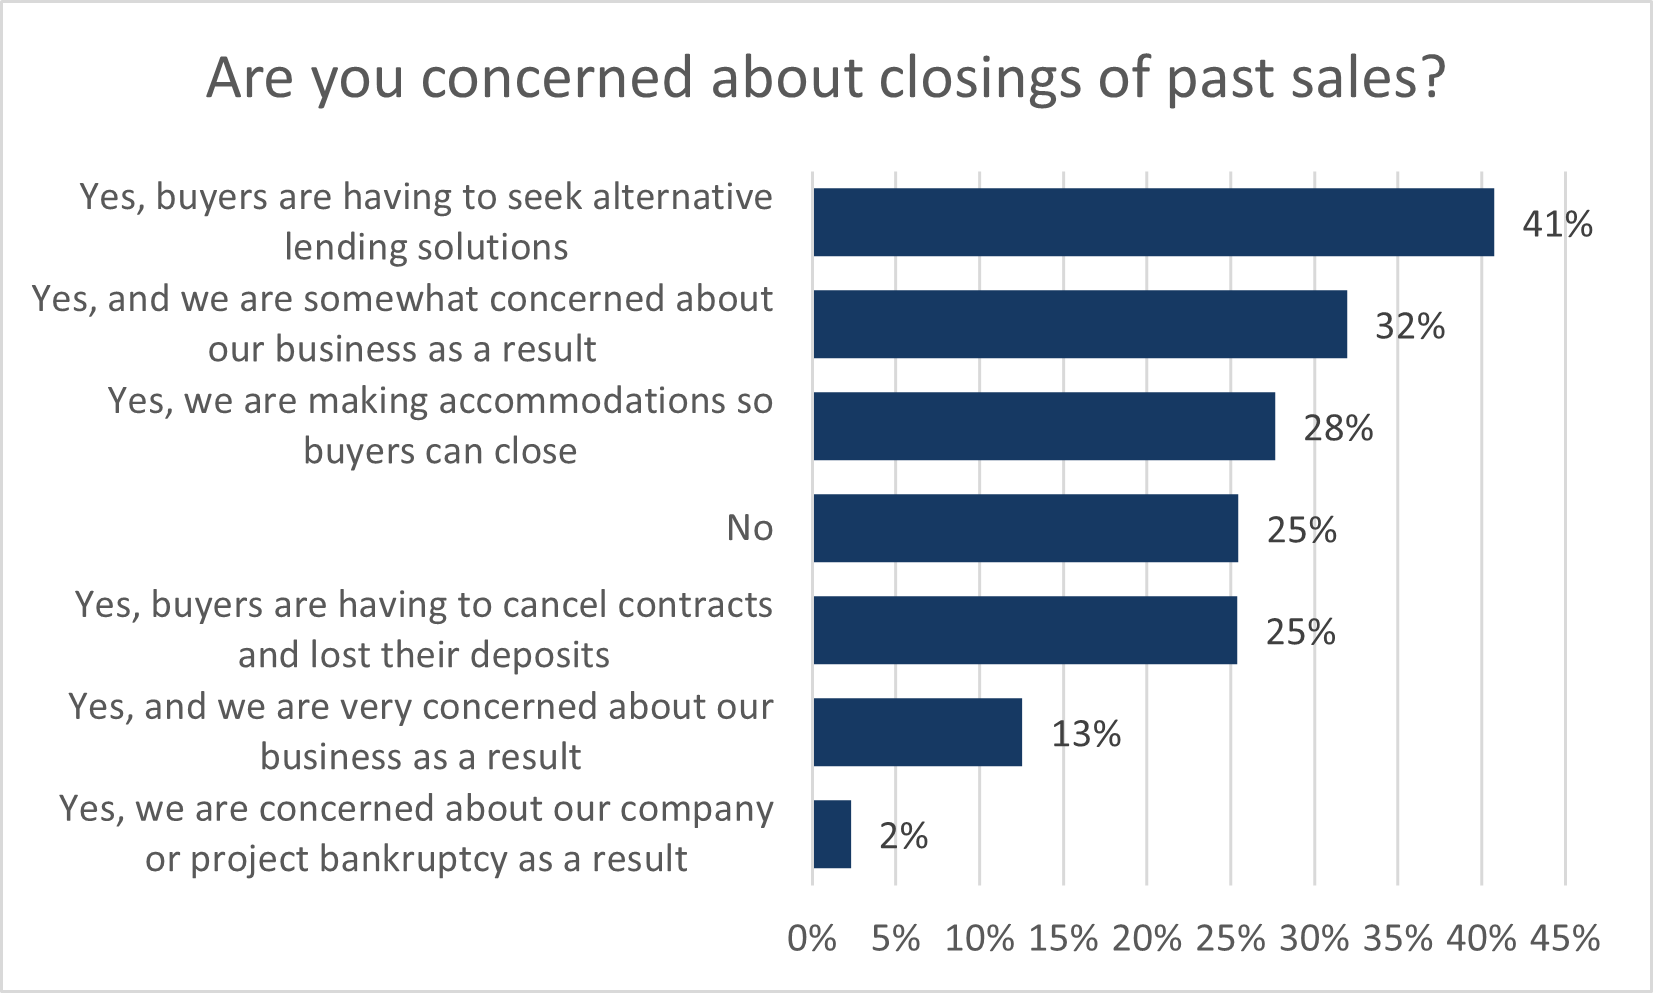
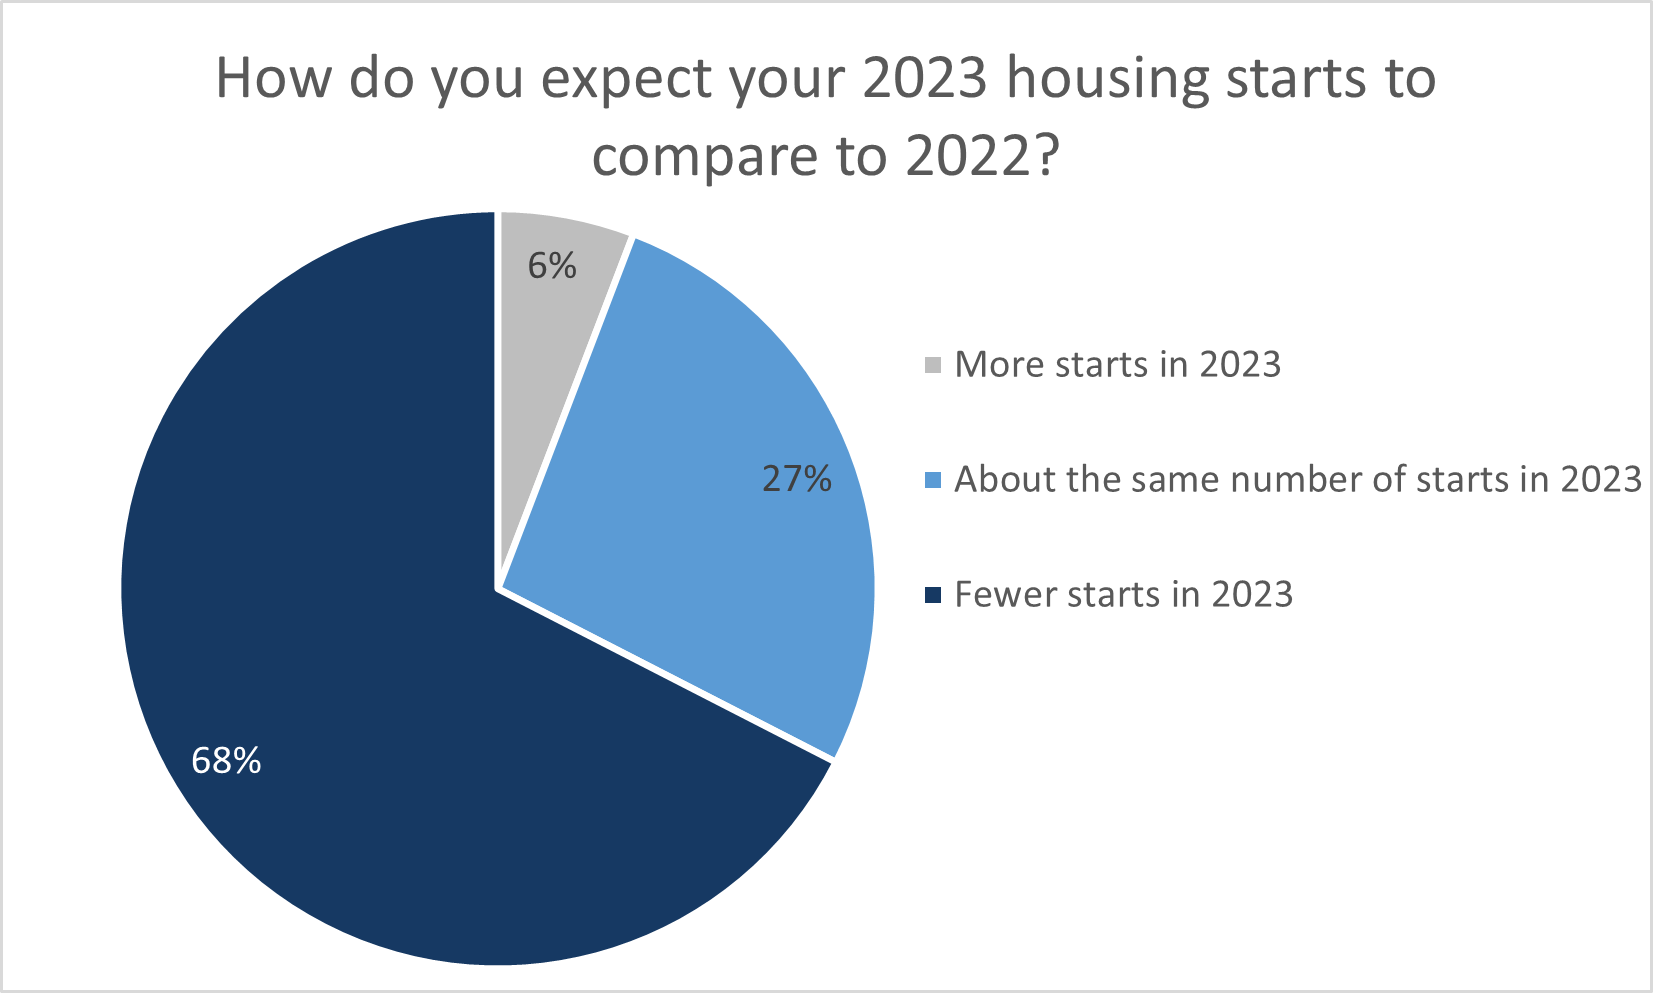
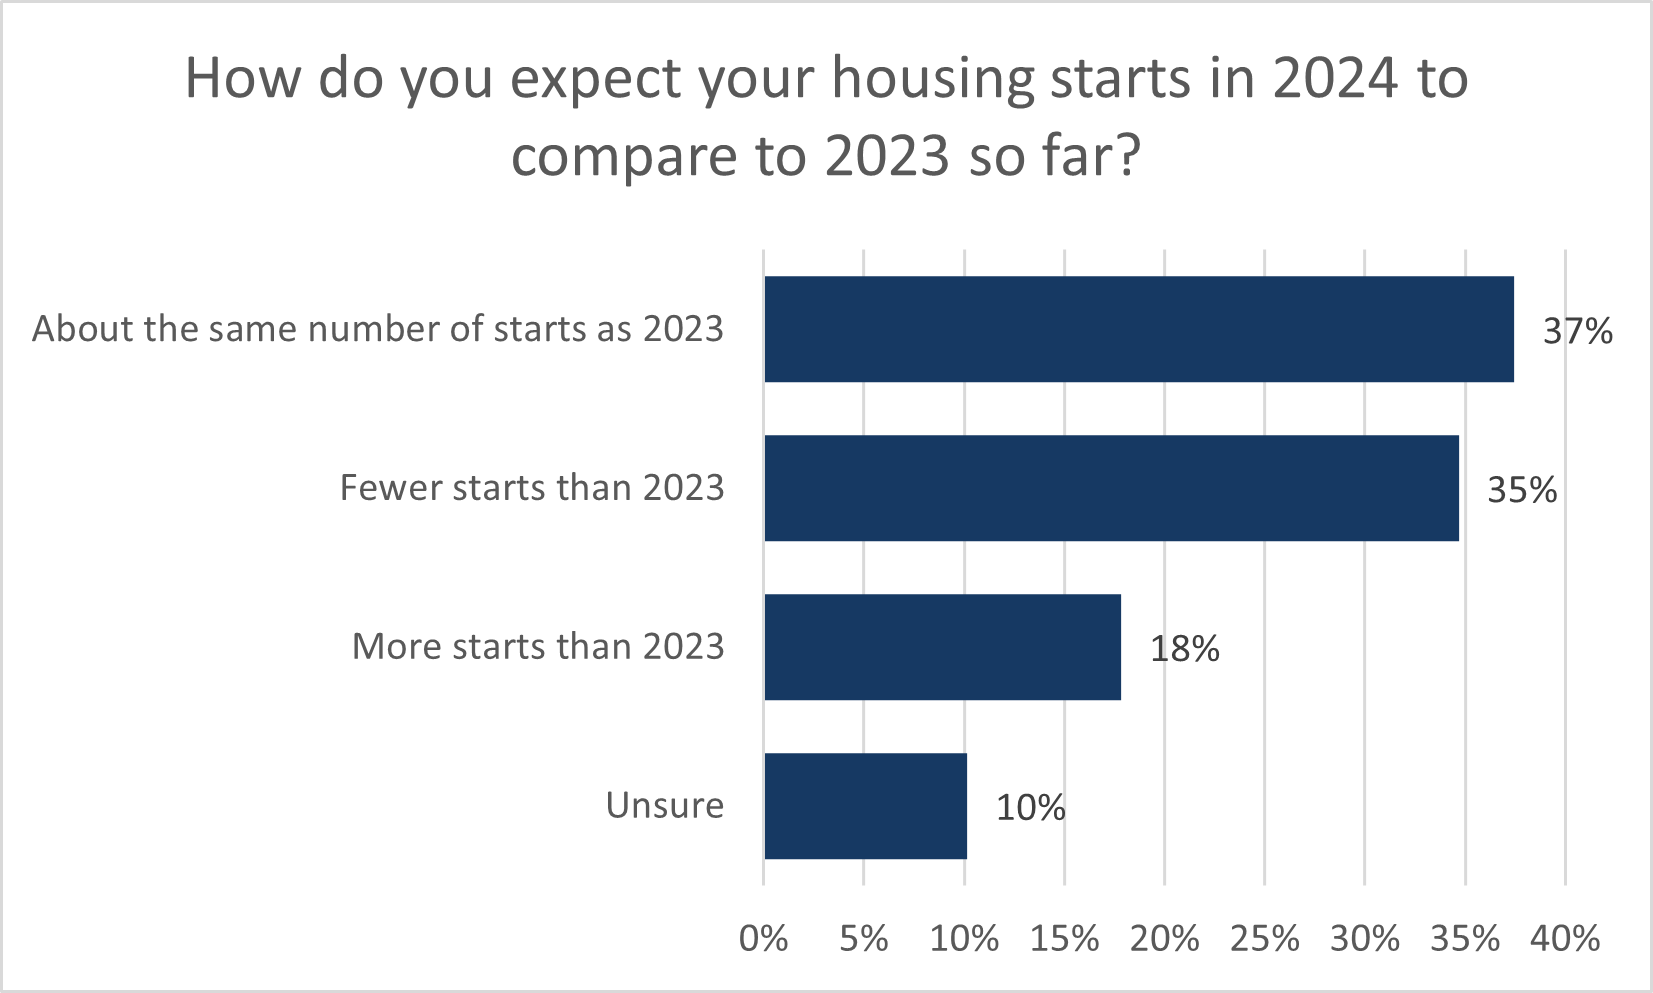
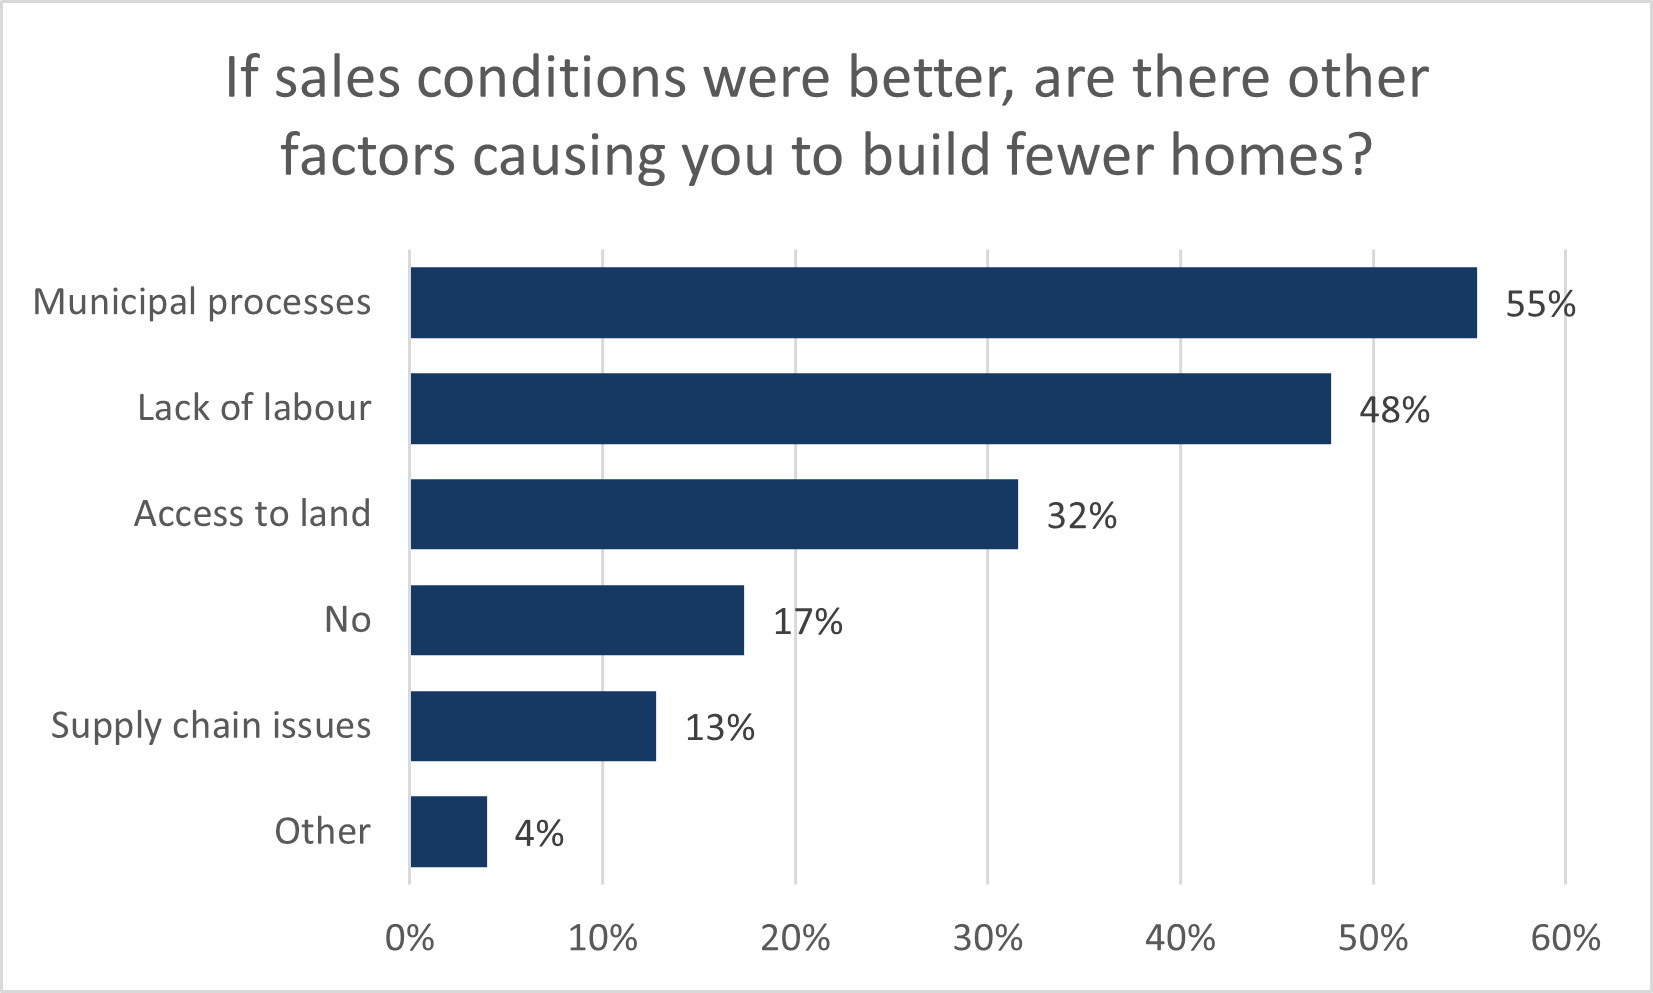
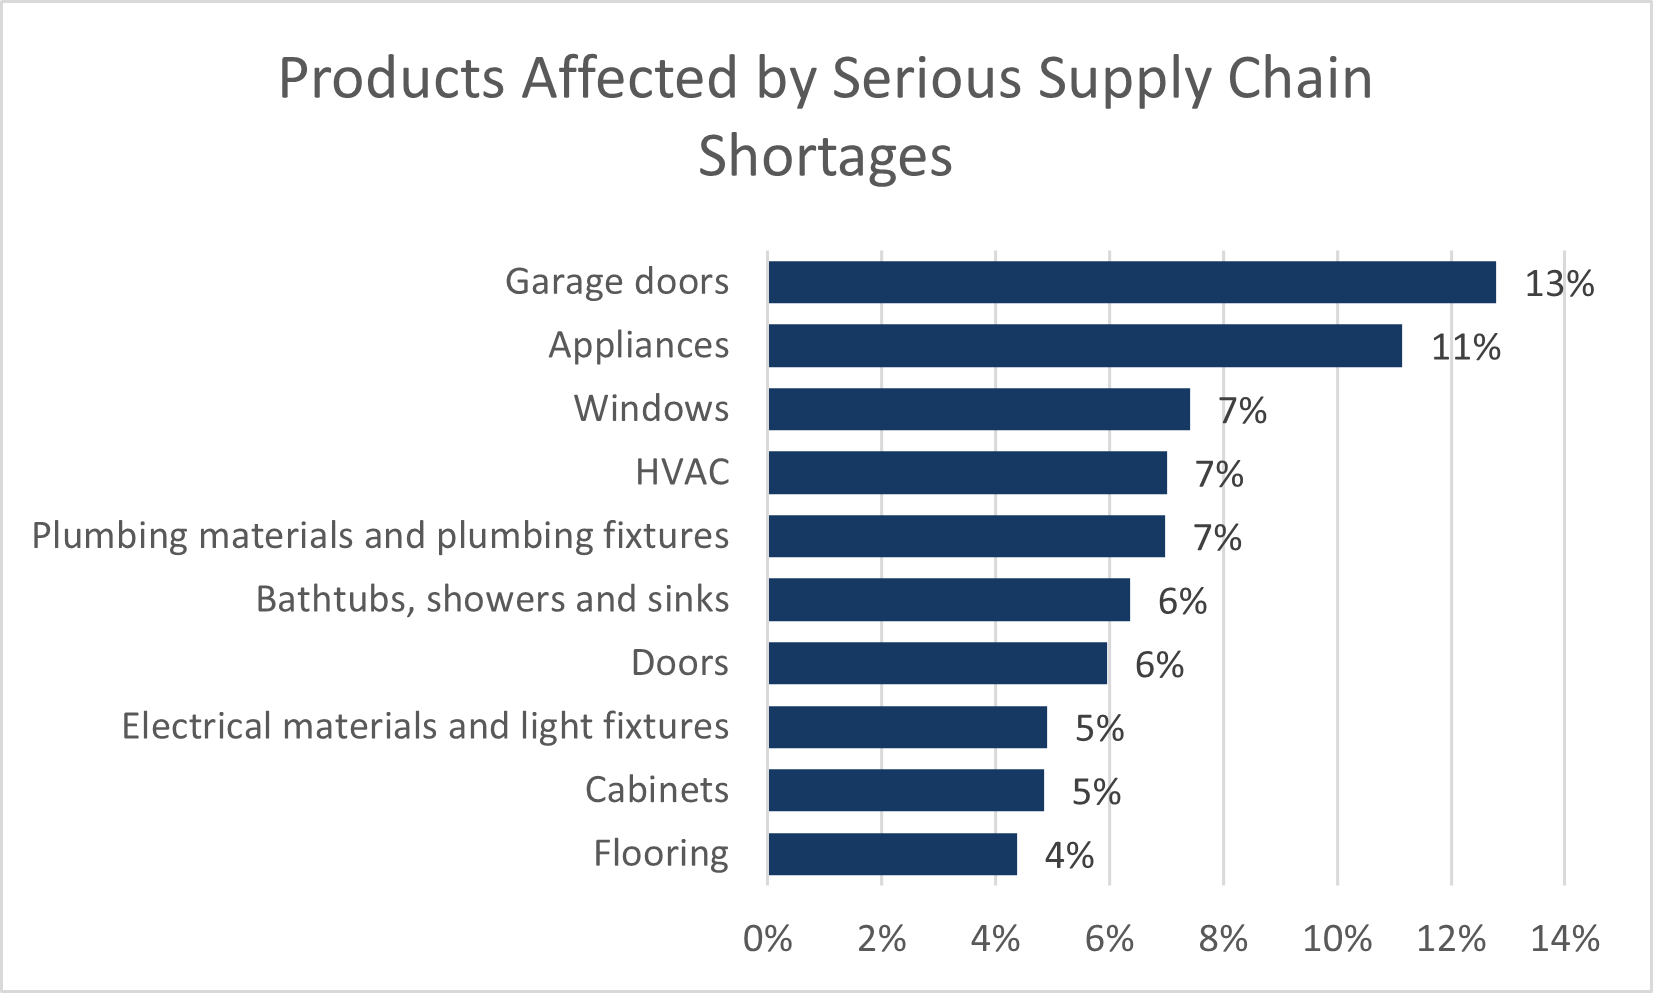
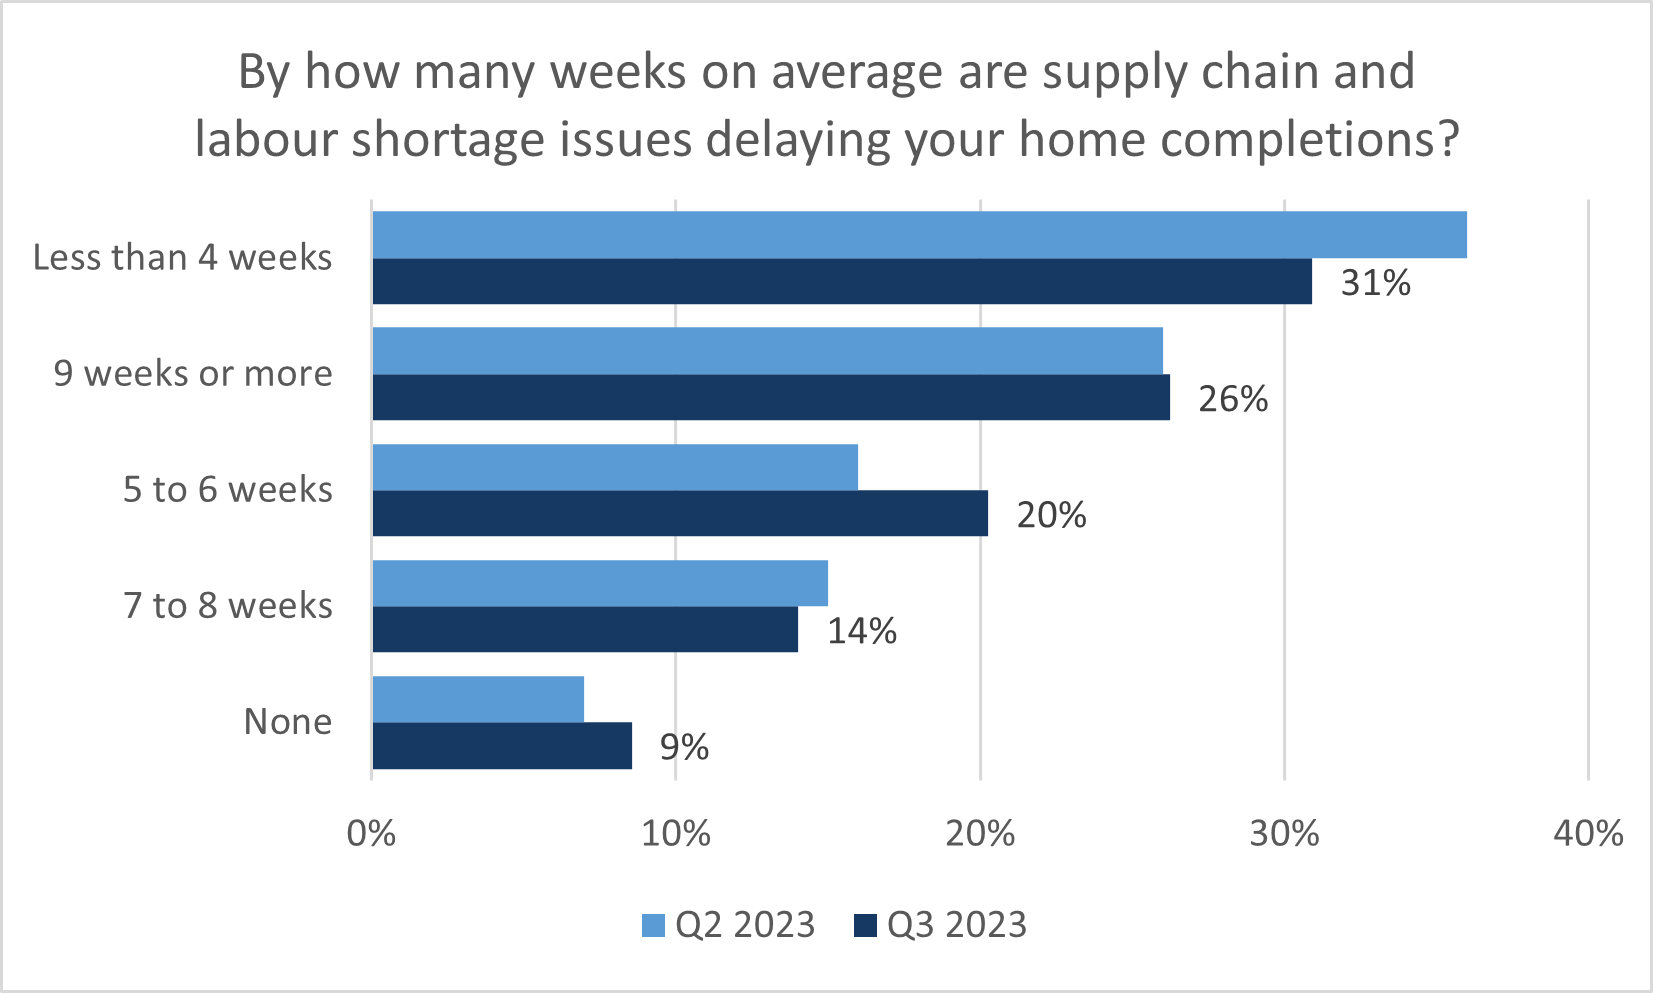
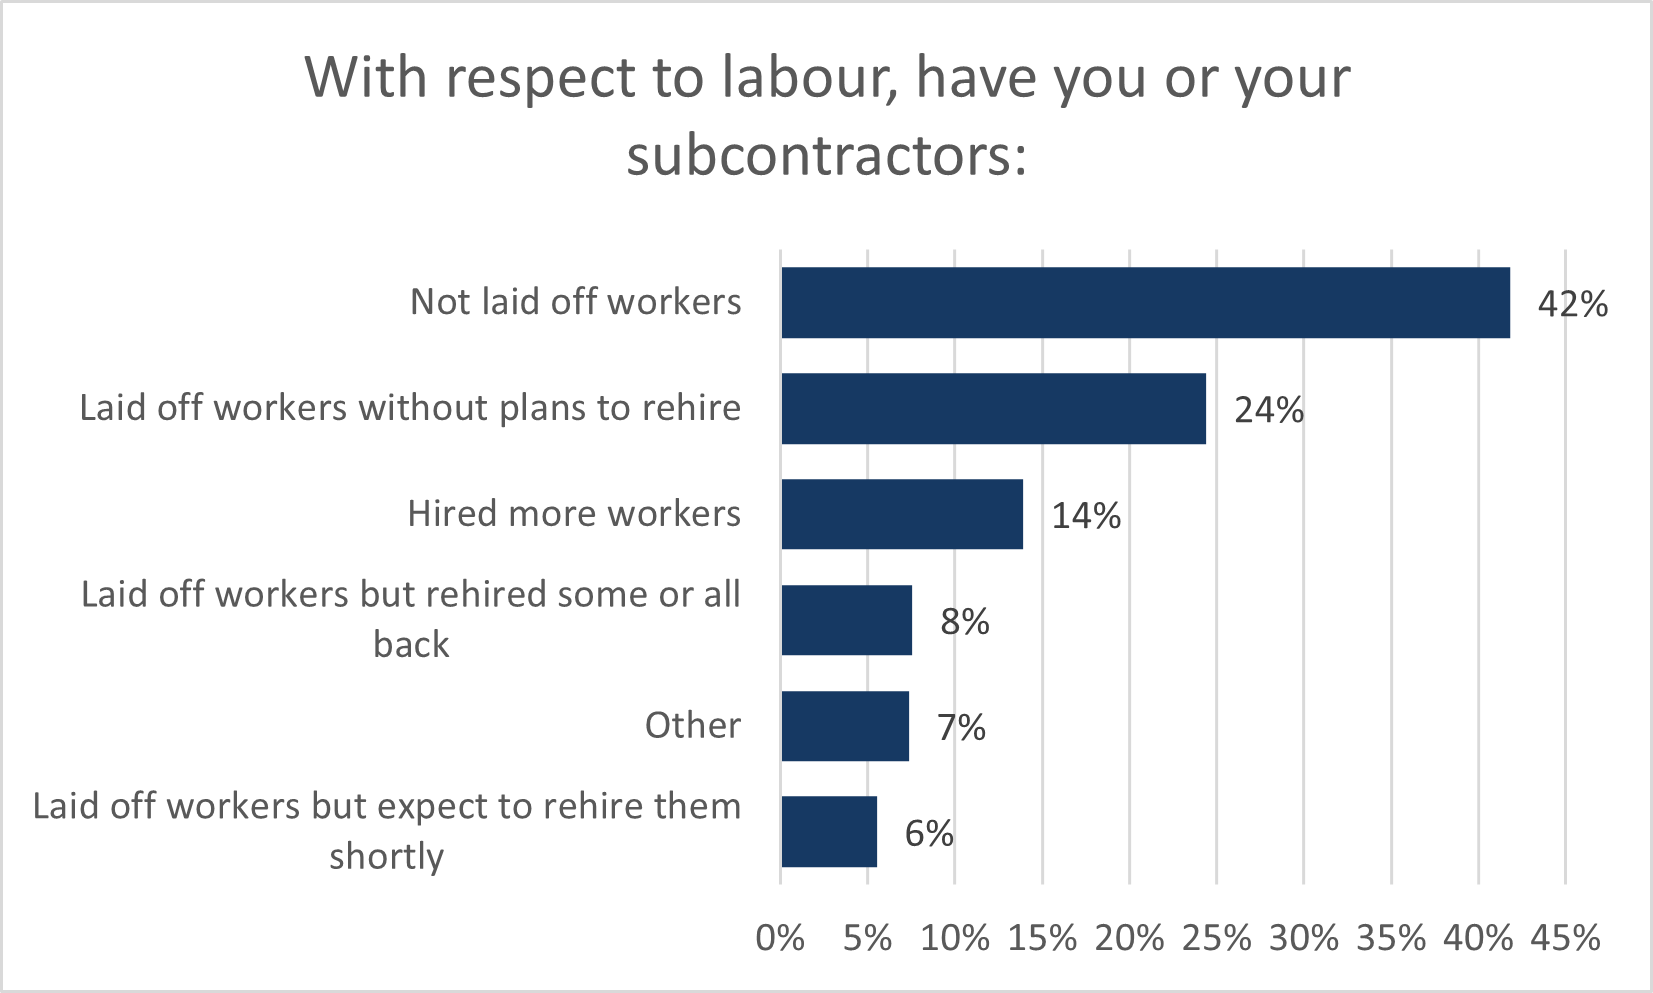
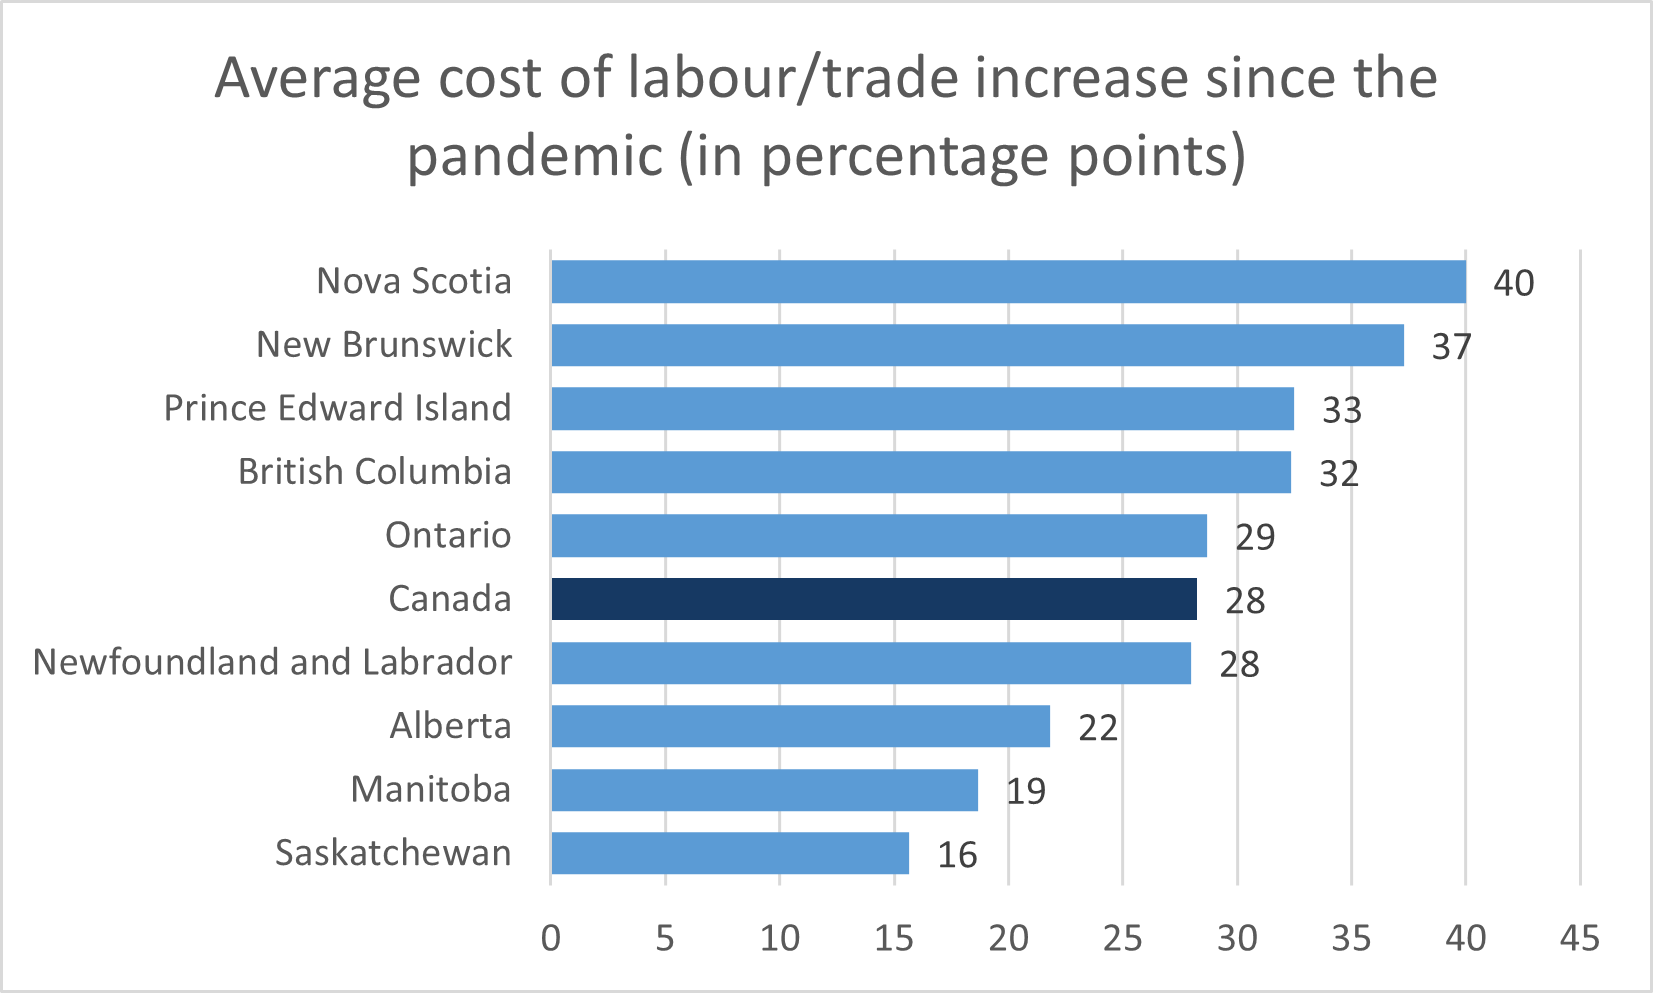
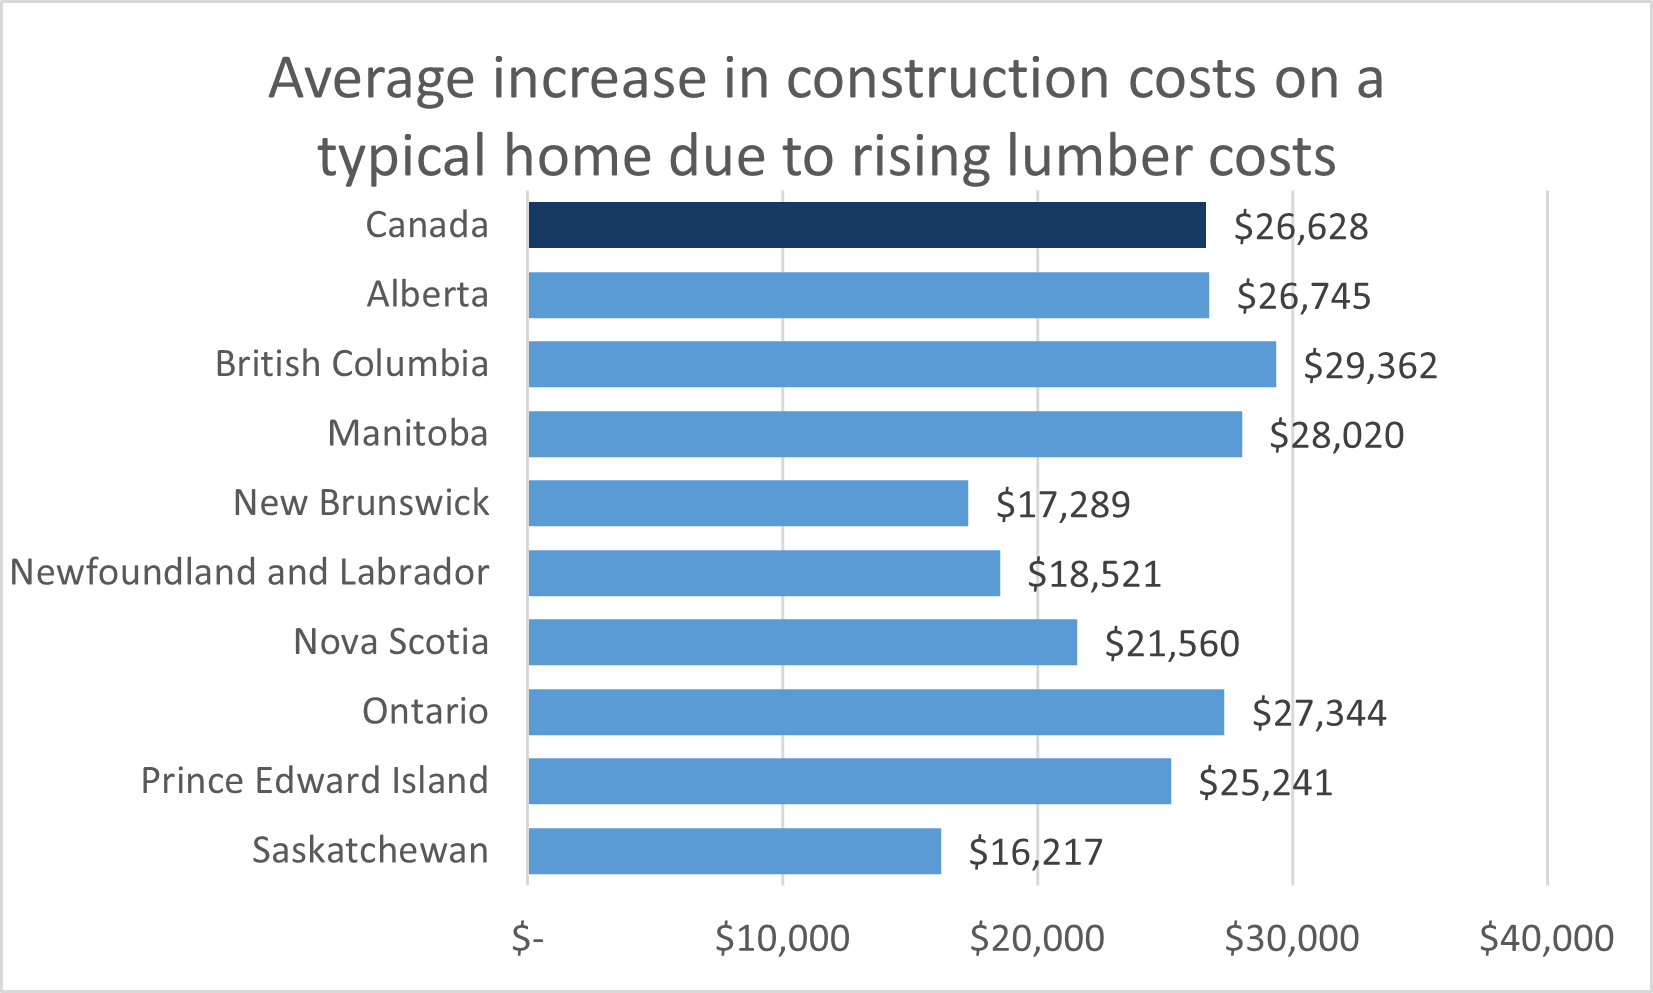
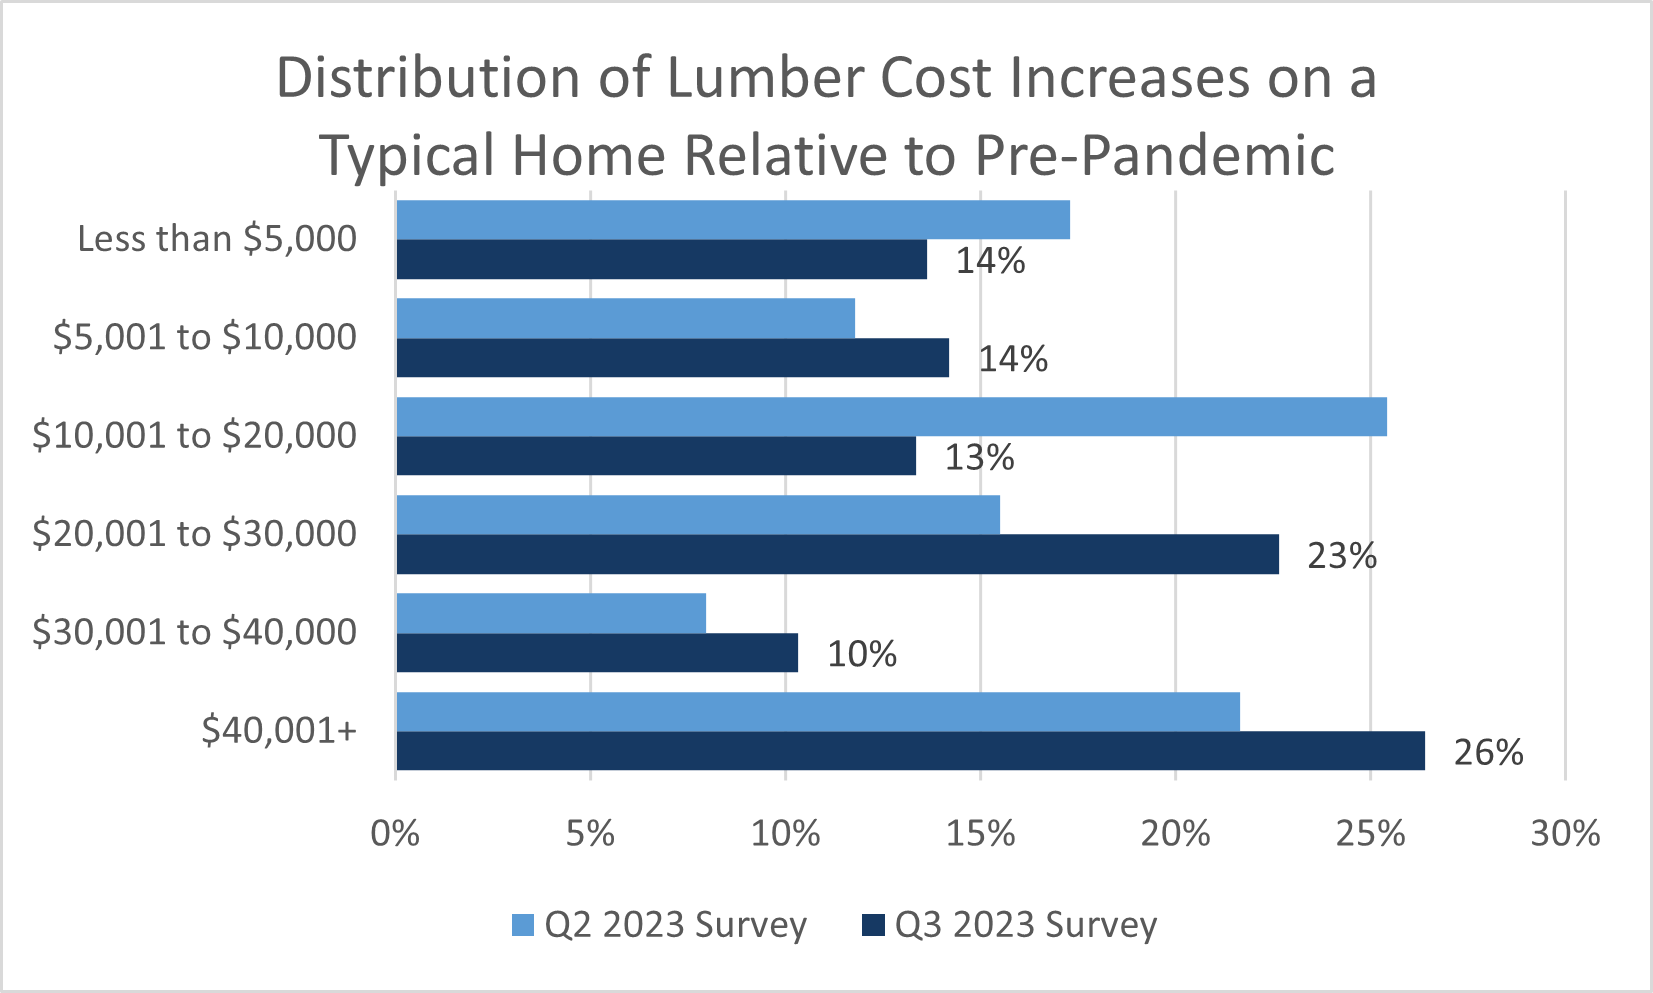
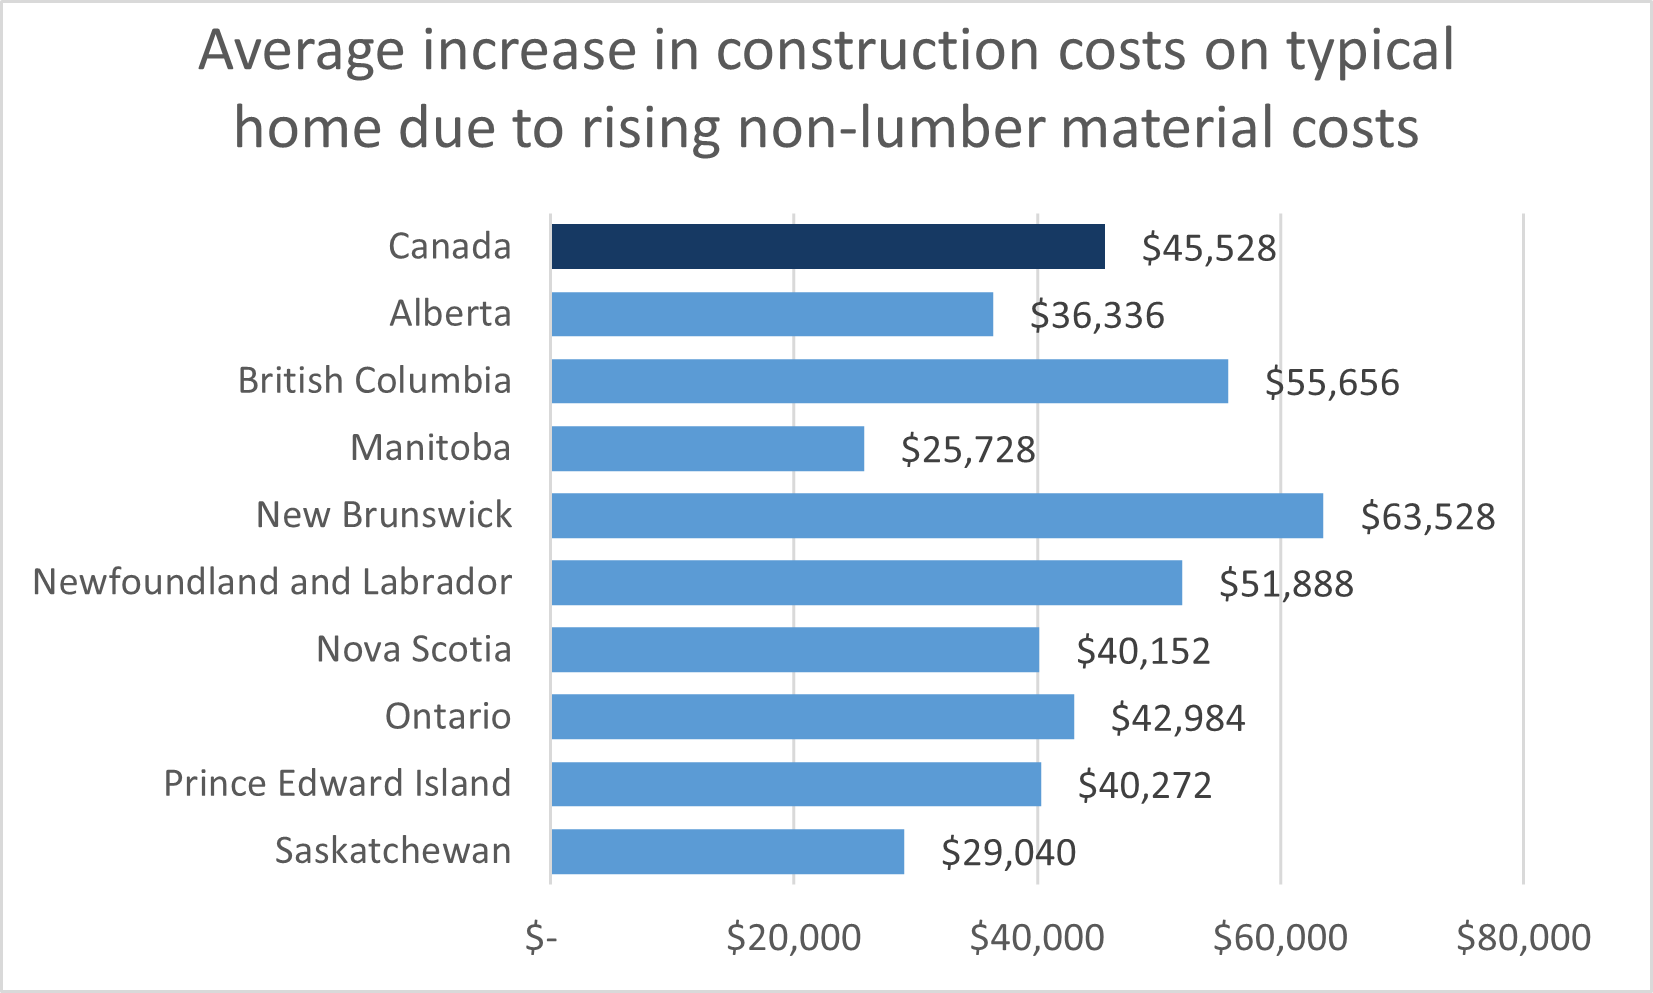
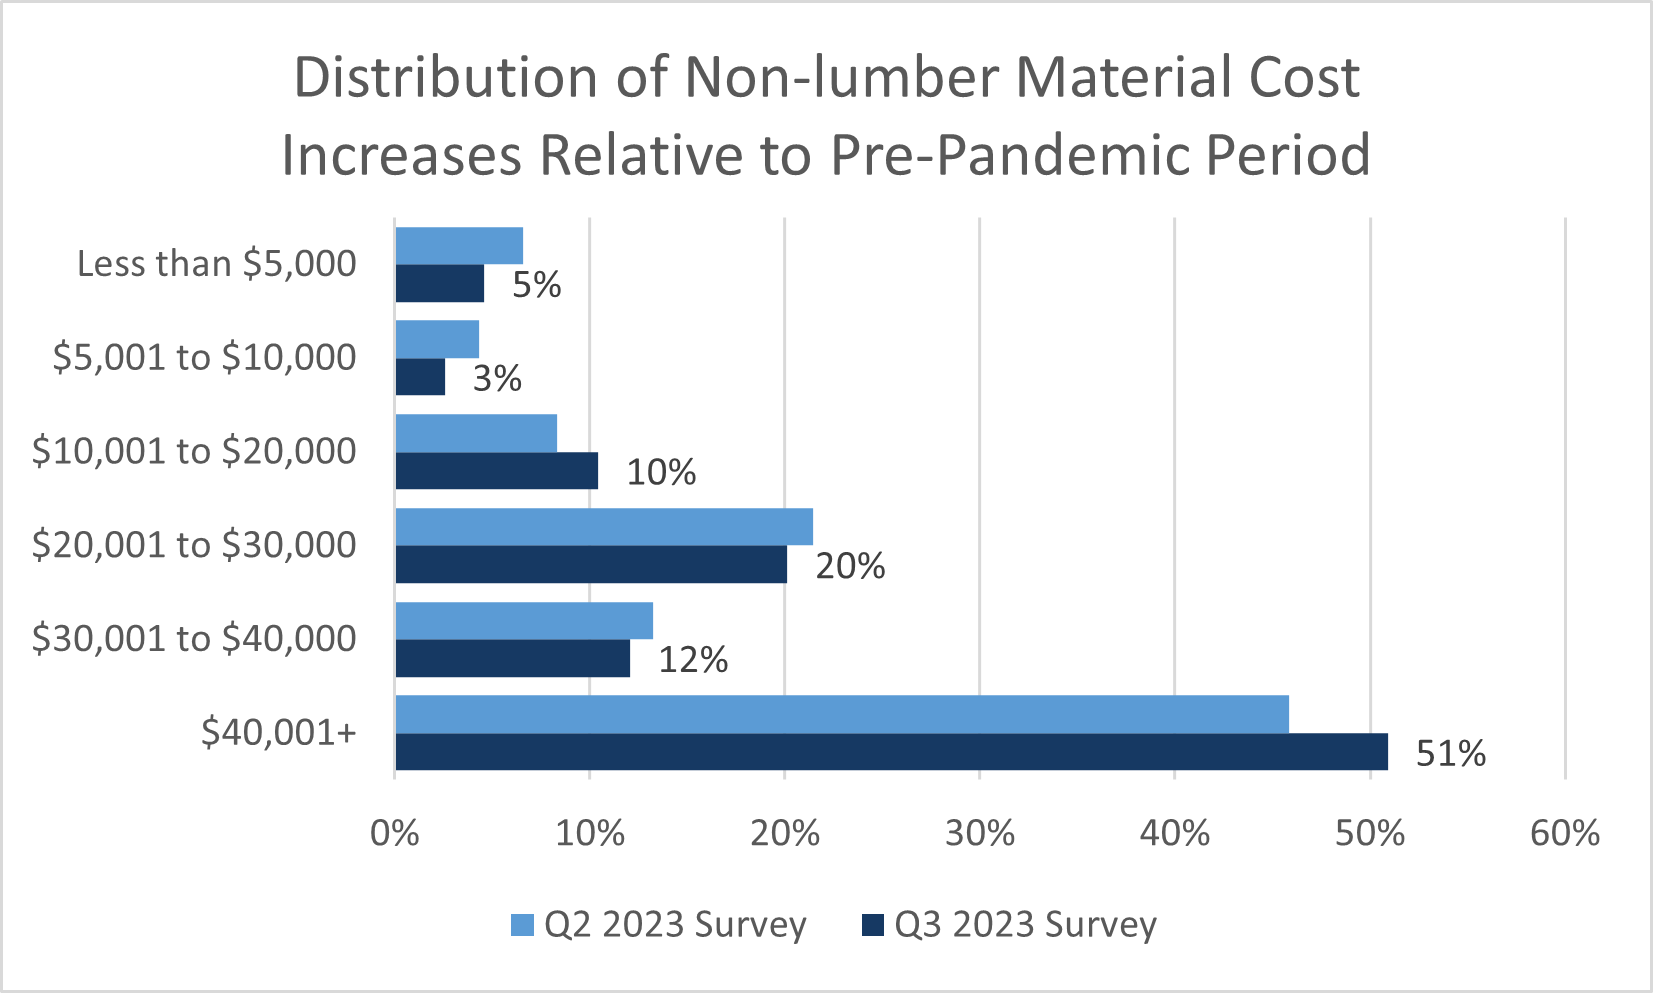
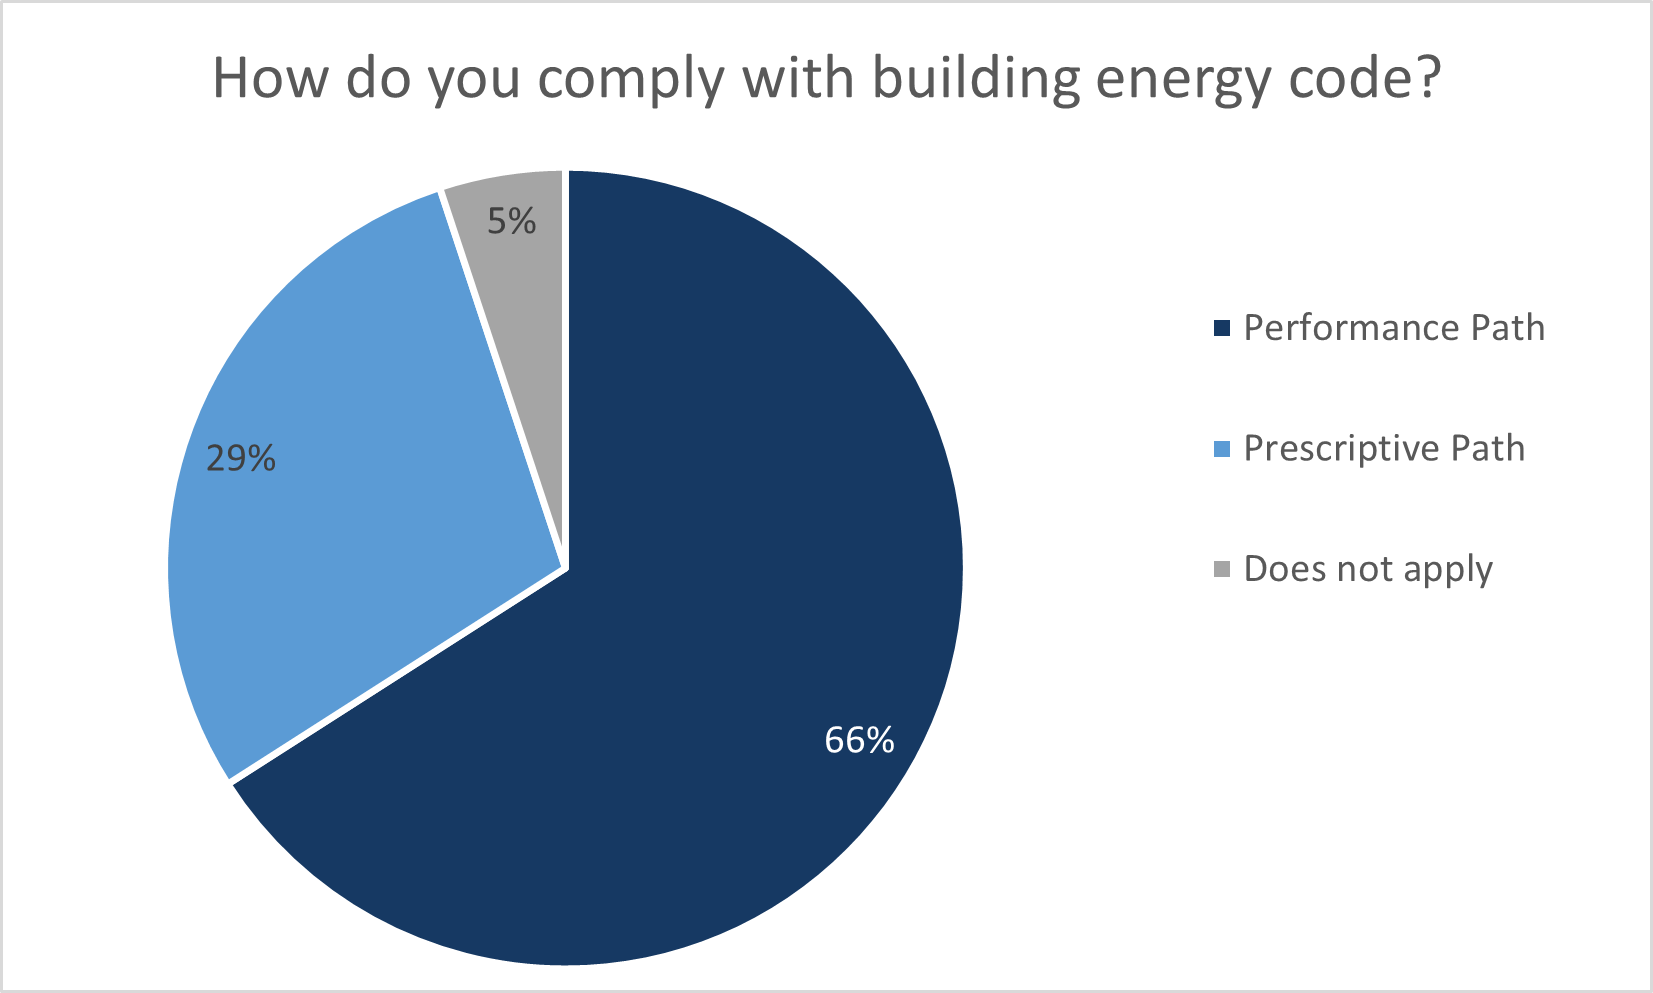
- The CHBA HMI for single-family builders remains low at 39.9 in Q2 2023. While this represents a second consecutive increase after falling substantially between Q1 and Q4 2022, it still reflects a downbeat sentiment—well below a neutral value of 50. The single-family HMI rose 5.6 points from 34.3 in Q1 2023 but is down 25.8 points from 65.7 recorded a year ago in Q2 2022, and substantially down from its high of 89.4 in Q1 2022 before interest rates started rising.
- Although interest rates created a challenging environment to qualify for a home purchase, the Bank of Canada pausing its successive rate hikes helped improve builder sentiment with some improvement in the downtrodden market. Additionally, the index was given a boost from the traditional busy season coming out of winter.
- 48% of respondents characterized current selling conditions as Fair and 32% rated conditions as Poor.
- Regionally, half of respondents from Ontario rated current conditions as Poor. Responses from the rest of Canada were more likely to select Fair conditions.
- Looking ahead, 51%, characterized their view of future conditions as Fair. 29% of respondents reported future conditions as Poor. These proportions were similar to the previous quarter. Relative to a year ago, Q2 2022 the proportion of respondents expecting poor sales conditions rose 15 percentage points from 14%.
- All regions were most likely to rate future conditions as Fair, which was the case in the previous quarter as well. While still sensitive to interest rates, builders are assuming these conditions will persist for the foreseeable future and are adapting accordingly.
- Only 5% of respondents characterized traffic of prospective buyers as High or Very High. This proportion is the same as last quarter but far below the 24% that reported High or Very High sales traffic in Q2 2022. 45% of single-family builders gave a rating of Low or Very low. This is 8 percentage points lower than the 53% reported last quarter but 21 percentage points above the 24% that selected this rating in Q2 2022. While prospective traffic continues to return slowly, it remains definitively below conditions seen in the same quarter last year.
.png)
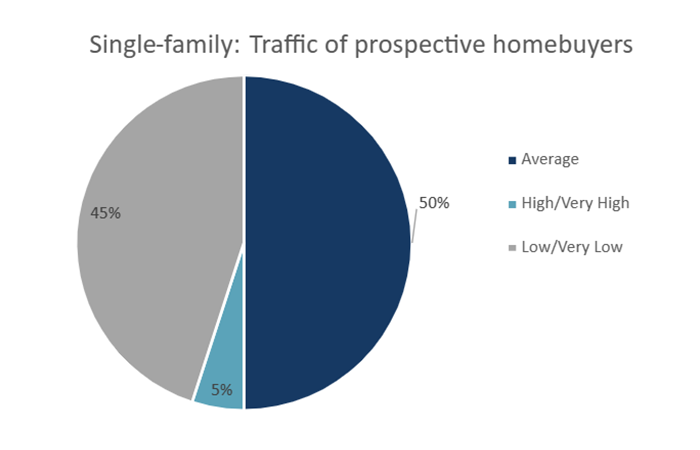
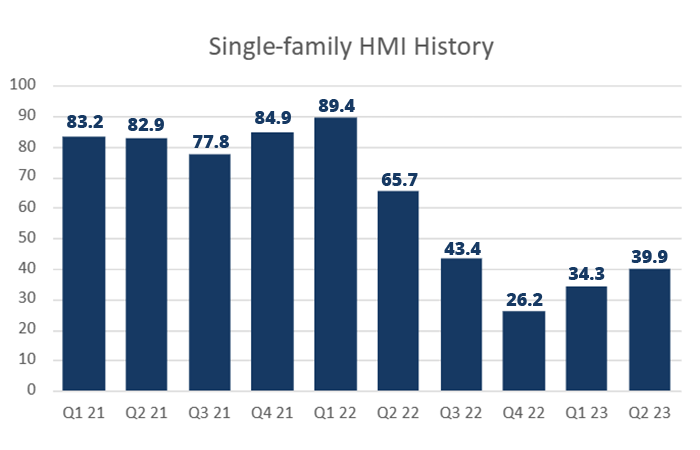
- The CHBA HMI for multi-family builders remained low at 41.0 in Q2 2023, though up 7.5 points from 33.5 reported in Q1 2023. Relative to the same quarter last year, the multi-family HMI is down 18.9 points from 59.9, and well below the high of 88.8 of Q1 2022 before interest rates started rising.
- 39% of multi-family builders rated current conditions as Fair, up 2 percentage points from Q1 2023 results. 37% rated conditions as Poor, which is down 9 percentage points from the previous quarter. Both the pause on interest rate hikes and spring uptick in activity likely helped improve current conditions in Q2 2023.
- The balance of responses for the expectation of future selling conditions deteriorated from the previous quarter. 47% of multi-family builders estimated their future selling conditions as Fair, this was down from 54% in Q1 2023. The proportion of respondents rating future conditions as Poor rose 9 percentage points from 25% in the previous quarter to 34%. This deterioration is no doubt a direct reflection of the increase in interest rates after the winter pause.
- The proportion of multi-family builders expecting Poor future sales conditions grew between Q1 and Q2 2023 in British Columbia, Ontario, and Prairie provinces. In Ontario, expectations were split between Fair and Poor, both at 43%.
- Prospective buyer traffic in sales offices improved slightly from Q1 2023. 43% of respondents reported Low or Very Low traffic, which was down 12 percentage points from Q1 2023. Equivalently, 43% or respondents reported Average traffic volumes.
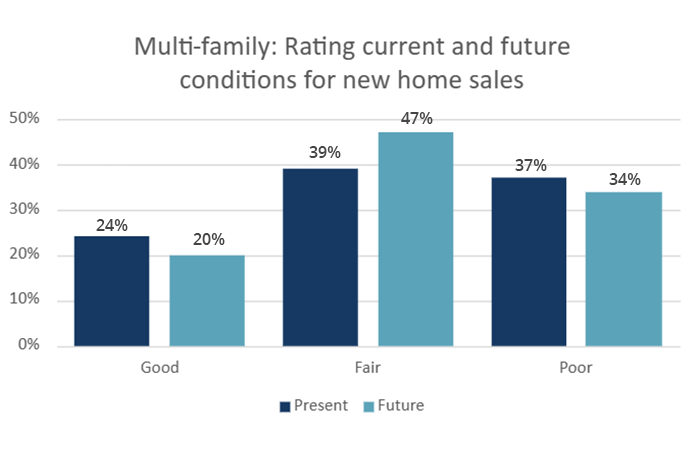
.png)
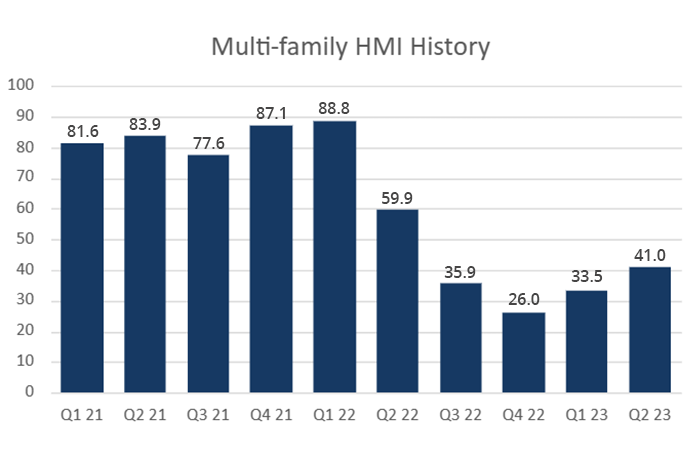
In addition to the survey questions that help develop the HMI, CHBA includes additional “special questions” to ask the expert panel. These special questions allow us to better understand the results of the HMI and gain insights into other industry issues. The following are some of the findings from the special questions in the Q2 survey:
- Relative to Q1 2023, the impact rising interest rates had on traffic in sales offices was quite similar in Q2 2023. 39% of respondents noted that while they were negatively impacts, that traffic had rebounded somewhat. However, 36% stated that traffic was still down as a result from monetary tightening. Some builders commented that while traffic was average, that conversions to sales were down likely due to financing challenges. Some builders commented that traffic slowed after the rate hike in early June.
- Builders were asked about their level concern about their business for the second half of 2023, with 52% of panelists were somewhat concerned. 11% stated that they were extremely concerned about wellbeing of their business, while 14% were not concerned.
- In relation to the concern about their business, CHBA asked about recent changes to a builder’s employment levels—including subcontractors. Despite a slower market, the shortage of workers and tight labour market are reflected in the fact that 44%, builders did not need to lay off any workers. Still, 20% reported having laid off workers without plans to rehire later. Meanwhile, 17% had increased their headcount.
- As with previous quarters, we asked about the level of concern specifically over current and future closings of previous sales due to interest rates. 49% of builders stated that they have buyers that are having to seek alternative lending solutions. 34% reported that they needed to make accommodations for some buyers to close. Only, 22% reported that it was not a concern.
- 67% of CHBA’s expert industry panelists stated that the slowdown in the market is causing them to build fewer units, deteriorating from 59% reported in the previous two quarters. 22% said that the slowdown is causing them to cancel projects entirely (similar to the 23% of panelists in Q1 2023).
- While labour shortages remain a significant problem industry wide, the slower 2023 market has helped 47% of respondents with access to trades. In addition, 52% reported that access to building material has improved as a result as well.
- We asked builders if they expect to have the same number of housing starts this year as they did in 2022. Halfway through 2023, 59% of builders expect fewer starts, 30% expect their starts to remain about the same, and 10% said they anticipate more starts than last year.
- From builders that expect fewer starts this year, the average percent decline was 40%. This is a slightly smaller decline than the 44% average reported in the Q1 survey.
- Out of the panelists that expected to start construction of more homes this year, the average increase was 44%. This was similar to last quarter’s results, where a small number of builders were expecting of a much busier year.
- While comments from panelists indicate that material availability is back to normal for some builders, supply chain issues are an on going challenge for members.
- Items with the highest incidence of being in serious shortage remains appliances (21%) and garage doors (17%). These items were also most in shortage in previous quarters, when overall supply chain issues were more acute.
- With the slowing of the market, there is also a decline in delay times caused by supply chain issues or labour shortages. The Q2 2023 average of a builder’s average delay time was 7 weeks, down from 8 and 10 weeks in the previous two quarters, respectively. Between Q1 and Q2, average reported delay times declined in every province except Manitoba, where it remained at 8 weeks.
- Despite improvement in access to trades, cause by a slowdown in the market, trades access and prices remain a pain point. 58% of panelists reported the prices of trades are up. While the issue is getting better, conditions are still poor. This is evident from 39% of panelists stating that access to trades is difficult, however 38% did state that access is getting better.
- The increase to labour costs compared to pre-pandemic remain high. The average of panelist’s costs of labour/trades have gone up 28%. This is up 2 percentage points from 26% reported in Q1 2023 and Q2 2022.
- The contribution of lumber prices to construction prices relative to pre-pandemic vary considerably across members. 43% of panelists estimated their lumber costs being up by $20,000 or more compared to prior to the pandemic (down from 52% in Q1 2023). 22% reported lumber costs still being up by $40,000 or more, which is the same proportion as Q1 2023. For a 2,400 square foot home, lumber prices have added $23,275, down modestly from Q1 2023 but down over 33% from Q2 2022.
- Builders were also asked about contribution of non-lumber materials to the cost of construction. With declines in the price of lumber and a continued shortage of some materials, significant contributions from non-lumber inputs are more prevalent among panelists. 46% of members stated that these goods have increased construction costs by over $40,000. For a 2,400 square foot home, non-lumber material has increased costs by $41,763 on average relative to pre-pandemic. This is slightly below the average reported in Q1 2023 but also slightly higher than the average reported in Q2 2022.
.png)
.png)
.png)
.png)
.png)
.png)
.png)
.png)
.png)
.png)
.png)
.png)
.png)
- The CHBA HMI for single-family builders was 34.3 in Q1 2023. This is the first increase in builder sentiment since Q1 2022. The single-family HMI is up 8.1 points from 26.2 from the previous quarter.
- The high interest rate environment has created a lot of uncertainty, but single-family builder sentiment is rebounding slightly as more builders are selecting Fair ratings for the conditions in the next six months.
- 43% of single-family builders rated current conditions as Poor and 40% as Fair.
- 28% rated future conditions as Poor (down 26 percentage points since Q4 2022), and 51% reported the future conditions to be Fair.
o In terms of future conditions, all regions were more likely to select a Fair rating. Last quarter, the majority of builders were more likely to select a Poor rating indicating conditions seem to be improving slightly. - Only 5% of single-family builders rated the traffic of prospective homebuyers to be High to Very High. This number is up 2 percentage points since the last survey. 53% of single-family builders rated the traffic of prospective homebuyers to be Low to Very Low (down 18 percentage points since Q4 2022). So a turnaround is being indicated, but overall conditions remain quite poor.
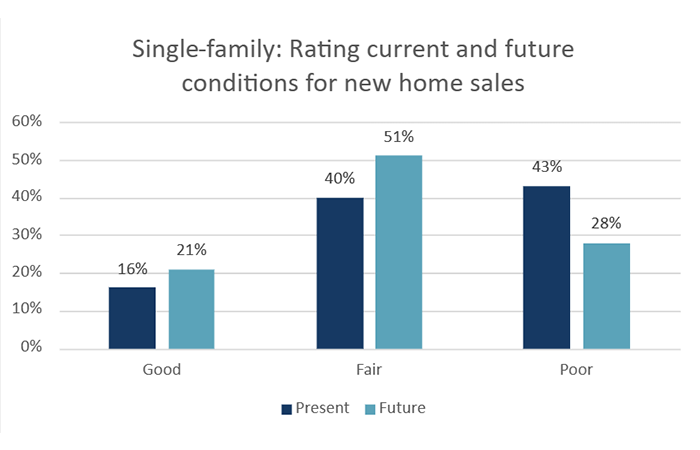
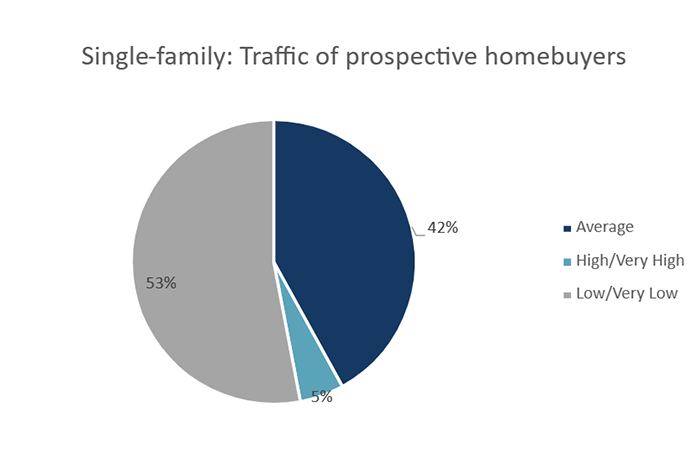
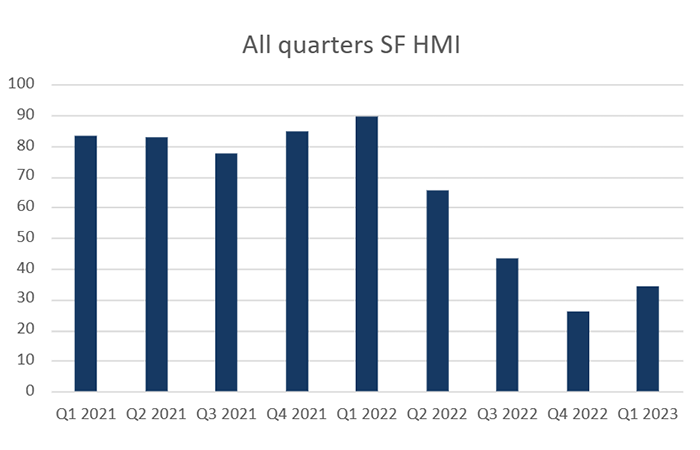
- The CHBA HMI for multi-family builders was 33.5 in Q1 2023. Multi-family sentiment is up 7.5 points from 26.0 last quarter (Q4 2022).
- 46% of multi-family builders rated current conditions as Poor (down 9 percentage points since Q4 2022) while 25% rated future conditions as Poor (down 20 percentage points from the previous quarter).
o In terms of future conditions, most regions were more likely to select a Fair rating except for the Atlantic Region where builders were more likely to select a Good rating. - Only 5% of multi-family builders indicated that they expect the traffic of prospective homebuyers to be High to Very High (this number is down by one percentage point). However, 55% of multi-family builders rated the traffic of prospective homebuyers to be Low to Very Low, down 13 percentage points since Q4 2022.
- In Q4 2022, 90% and 74% of builders in Ontario and the Prairie Provinces, respectively, rated traffic to be Low to Very Low. This quarter, 64% of builders in ON and 46% of builders rated traffic as Low to Very Low, indicating some progress towards improvements in the future.
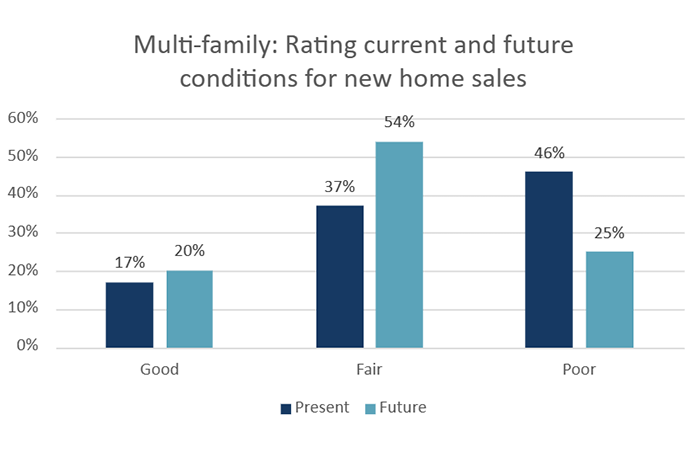
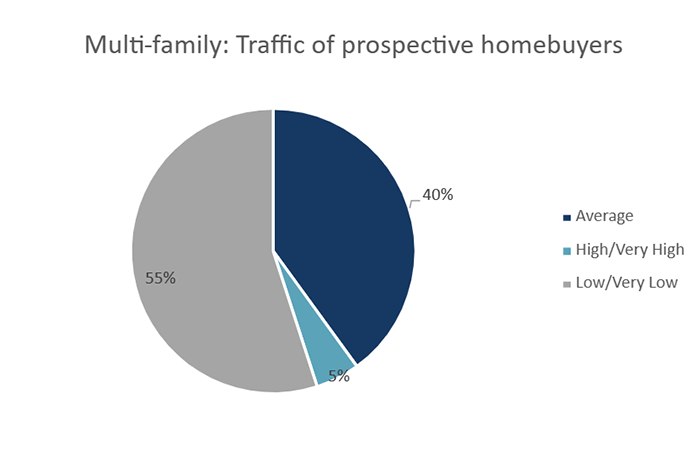
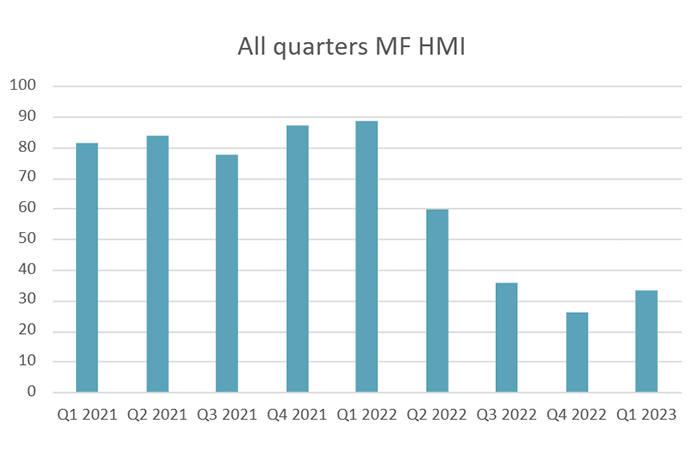
In addition to the survey questions that help develop the HMI, CHBA included additional “special questions” to ask the expert panel. These special questions allow us to better understand the results of the HMI and gain insights into other industry issues. The following are some of the findings from the special questions in the Q1 survey:
- The recent changes to interest rates have impacted the traffic of prospective homebuyers for CHBA members. Only 4% of members indicated that there was never any impact on the traffic of prospective homebuyers due to rising interest rates.
o 39% of members said that they were impacted, and that traffic has not started to return. 36% explained that traffic is starting to return somewhat. - We asked the panel if the new interest rate environment is causing them concern over current and future closings of previous sales. One third (33%) of homebuilders in Canada said yes and that buyers are having to seek alternative lending solutions and 30% (respectively) indicated that they are making accommodations so buyers can close and that they are somewhat concerned about their business as a result.
- 59% of CHBA's expert panel indicated that the slowdown in the market is causing them to build fewer units (unchanged from Q4 2022) and 23% said that it is causing them to cancel projects (down 7 percentage points since Q4 2022).
- On the positive side, the slowdown in the market has slightly improved access to trades according to 51% of CHBA's panel (up 8 percentage points since Q4 2022), leaving access to trades still a significant problem. 44% said that the slowdown improved access to materials (up 8 percentage points since Q4 2022).
- Last year in Q1 2022, we asked builders if they think their company will have as many housing starts in 2022 as it did in 2021 and 80% of builders said yes. After multiple interest rate hikes, we asked builders this Q1 how they expect their 2023 housing starts to compare to 2022.
o 64% stated they expect to have fewer starts in 2023 than they did in 2022 (down 8 percentage points since Q4 2022). On average, builders expect to have 44% fewer starts in 2023 (up 1 percentage point since Q4 2022).
o Only 9% expect to have more housing starts in 2023 (up 3 percentage points since Q4 2022). On average, builders expect to have 55% more starts in 2023 (up 14 percentage points since Q4 2022). - 52% of CHBA members said that their lumber costs were still up by more than $20,000 compared to prior to the pandemic (down 14 percentage points since Q4 2022) and 22% of respondents indicated that their costs are still up by more than $40,000 as a result of lumber prices (down 9 percentage points since Q4 2022). National average construction costs for a 2,400 sq ft home are up $24,390 (down 18 percentage points since Q4 2022). The highest average cost increase was found to be in British Columbia (at $29,563) and in Saskatchewan (at $27,723).
- We also asked our panelists about the increase in their construction costs as a result of higher prices for other materials (outside of lumber). About 83% of respondents said that their costs have gone up by more than $20,000 compared to prior to the pandemic(up 2 percentage points since Q4 2022).
o National average construction cost increases for a 2,400 sq ft home are $43,388 compared to prior to the pandemic, up 4 percentage points since Q4 2022. - Supply chain issues continue to be a challenge for CHBA's membership.
o In terms of serious shortages, appliances have now been replaced by garage doors as the most impacted product. This switch happened in Q4 2022 and continued into Q1 2023. - On average, supply chain issues have resulted in 8 weeks in delays in home completions for builders across Canada. The average delay is down two weeks since Q4 2022. The highest average delay was reported by CHBA members in British Columbia at 10 weeks.
- 63% of CHBA members explained that with respect to trades, prices are still up. This number is down 15 percentage points since Q4 2022. 40% of respondents also indicated that access to trades is difficult (down 16 percentage points since Q4 2022).
- On average, the cost of labour/trades has gone up 26%, compared to prior to the pandemic, down 2 percentage points from the previous quarter. The highest average labour cost increase was in Prince Edward Island (38%) and in New Brunswick (31%).
- Looking towards increased productivity in the face of fewer workers, 29% of CHBA members indicated they have produced/used factory-built components (e.g. wall panels, modules) in the past year.
o In the next 1-3 years, over 90% of members are considering producing/using factory-built components.
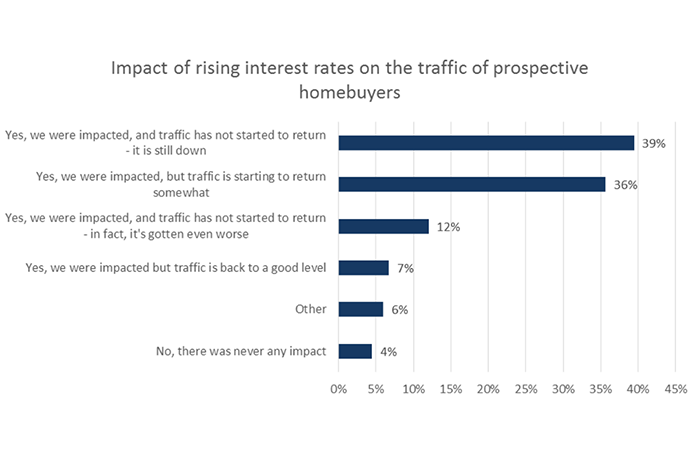
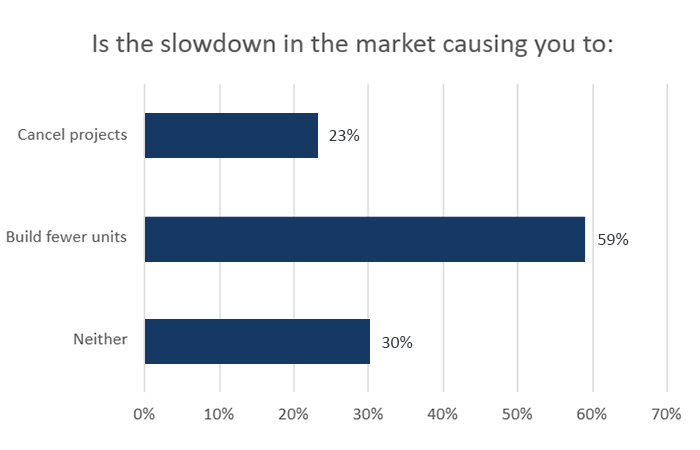
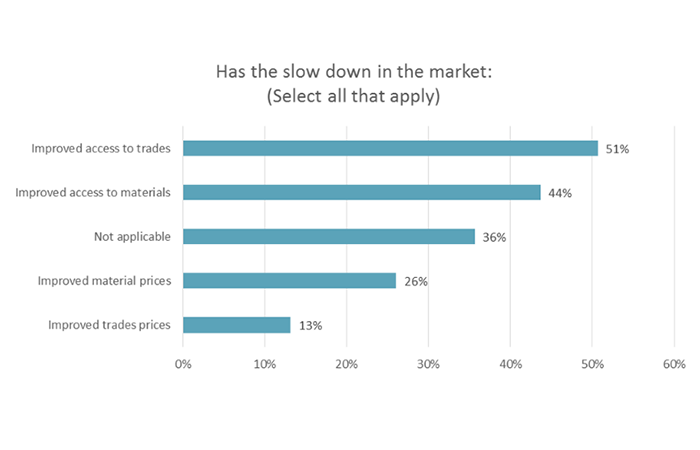
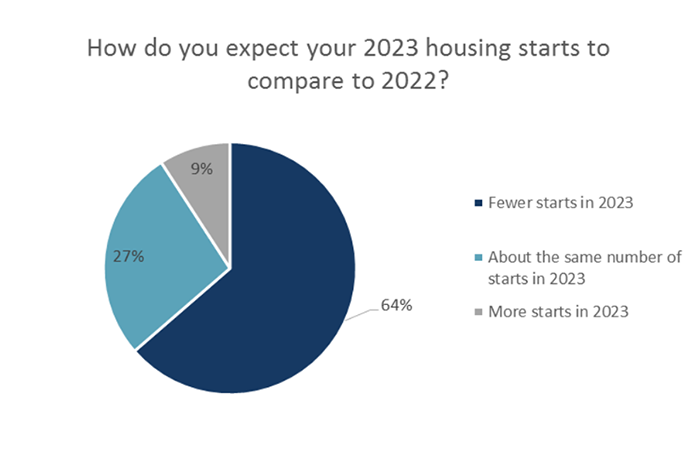
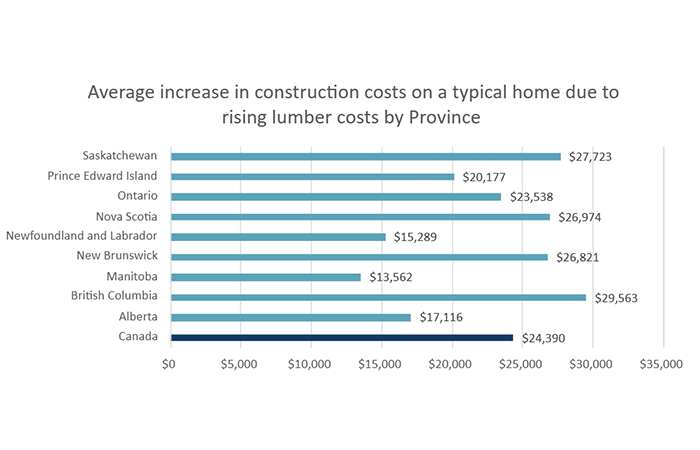
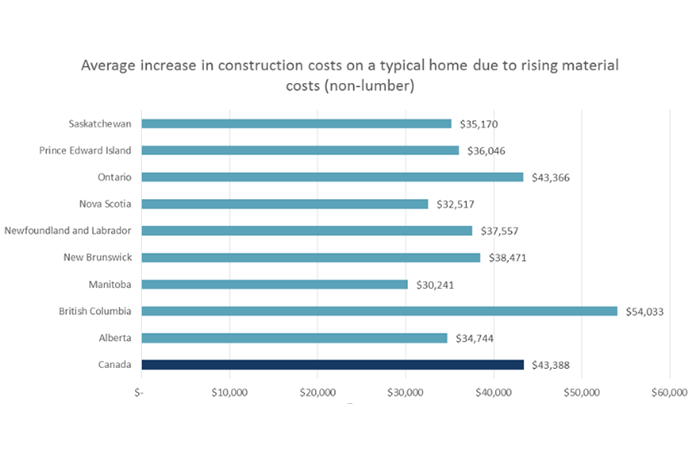
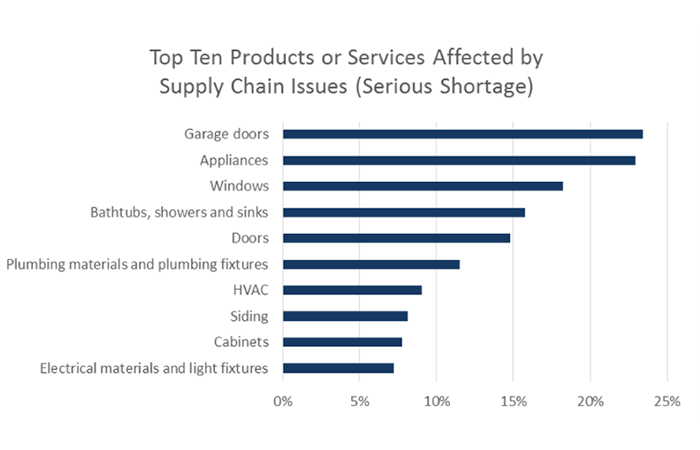
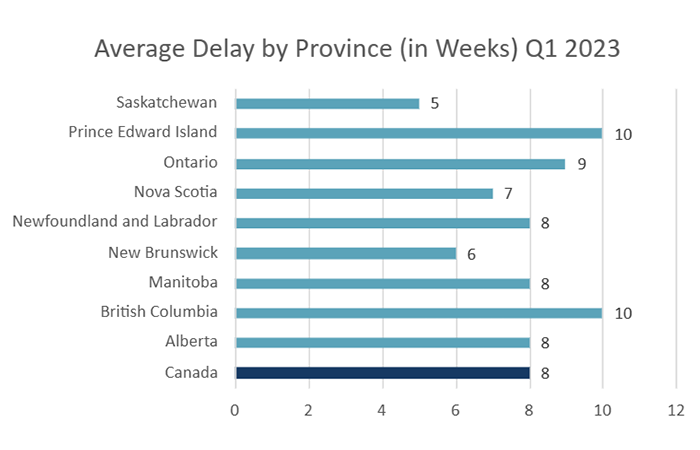
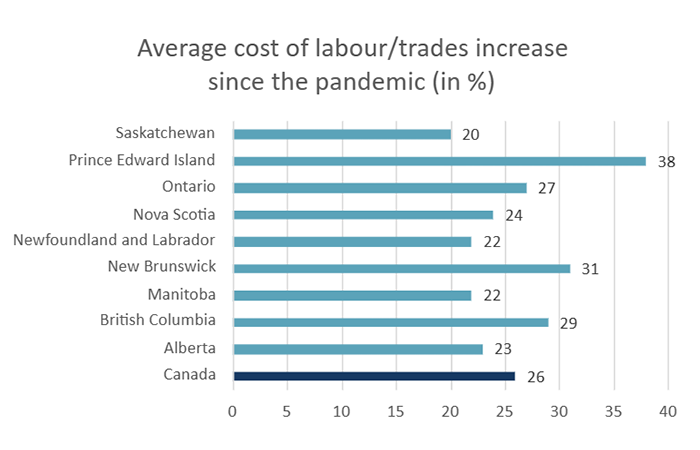
- The CHBA HMI for single-family builders was 26.2 in Q4 2022. This is the third major decline in builder sentiment this year. The single-family HMI is down 43.4 in Q3 2022 and its high of 89.4 in Q1 2022.
- 54% of single-family builders rated current conditions as Poor and 54% also rated future conditions as Poor.
o Builders in British Columbia and the Atlantic Region were more likely to select a Fair rating for current conditions, while an overwhelming 76% of builders in Ontario and 55% of builders in the Prairie Provinces rated current conditions as Poor. - Only 3% of single-family builders rated the traffic of prospective homebuyers to be High to Very High. This is down 4 percentage points since Q3 2022. 71% of single-family builders rated the traffic of prospective homebuyers to be Low to Very Low.
o All of the regions were most likely to select a Low to Very Low rating for the traffic of prospective homebuyers. The low sentiment was especially evident in Ontario and the Prairie Provinces where 82% and 78% of builders, respectively, rated the traffic to be Low to Very Low.
.png)
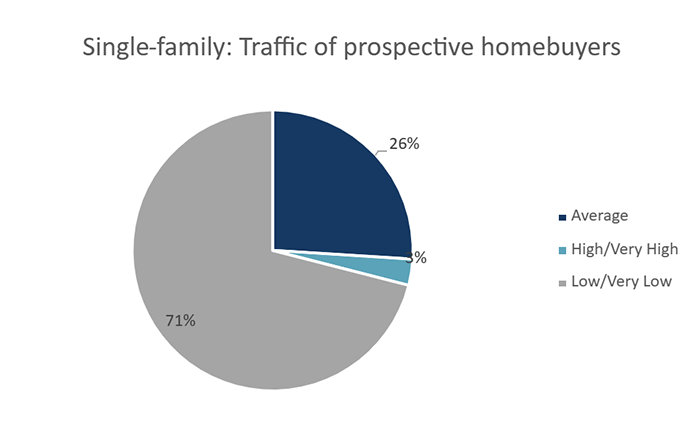
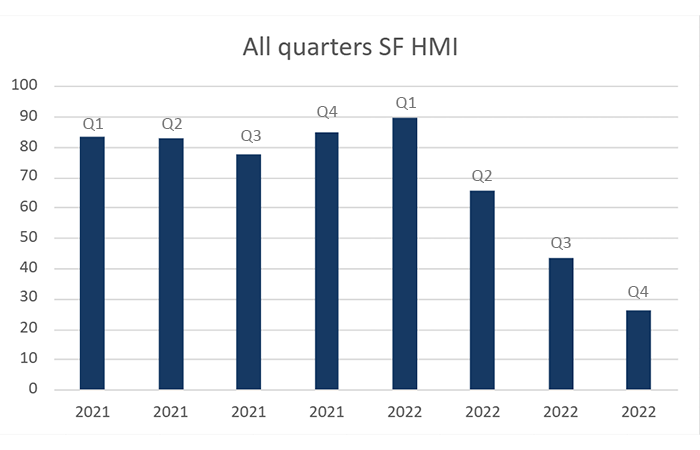
- The CHBA HMI for multi-family builders was 26.0 in Q4 2022. Multi-family sentiment is down 9.9 points from 35.9 since Q3 2022.
- Multi-family builder sentiment did not decline as rapidly as single-family builder sentiment in Q4 2022, but it has declined dramatically since Q1 when it was 88.8 points. Some builders explained that in some areas there could be more multi-family buyers but there is not enough supply. Increasing mortgage rates are creating a high level of uncertainty in both the single-family and multi-family markets.
- 55% of multi-family builders rated current conditions as Poor while 45% rated future conditions as Poor.
o In terms of future conditions, British Columbia and Atlantic builders were more likely to select a Fair rating, while Ontario and the Prairies were more likely to select poor. - Only 6% of multi-family builders indicated that they expect the traffic of prospective homebuyers to be High to Very High. 68% of multi-family builders rated the traffic of prospective homebuyers to be Low to Very Low, up 14 percentage points since Q3 2022.
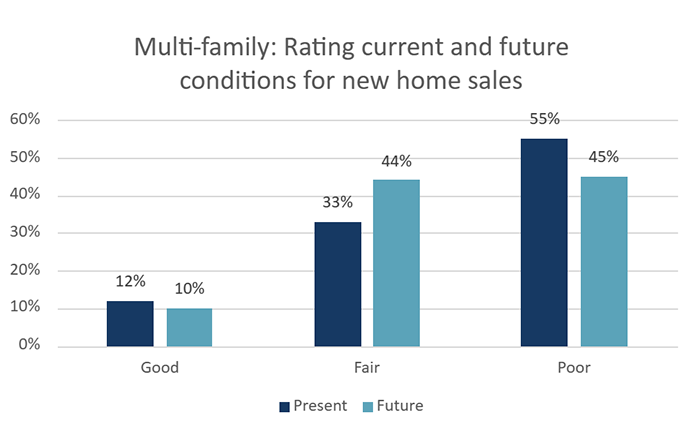
.png)
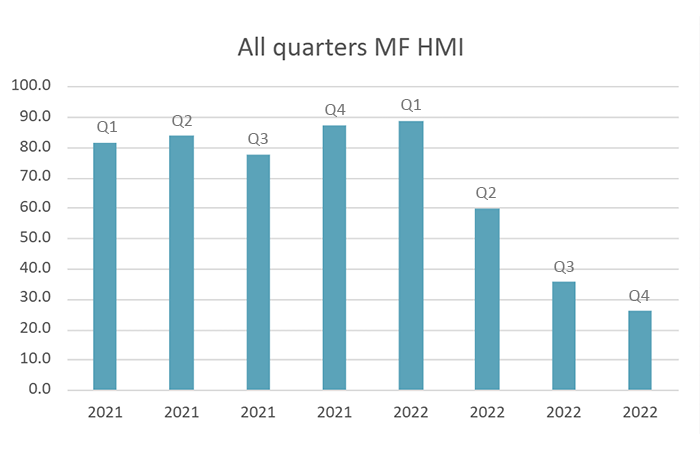
In addition to the survey questions that help develop the HMI, CHBA included additional “special questions” to ask the expert panel. These special questions allow us to better understand the results of the HMI and gain insights into other industry issues. The following are some of the findings from the special questions in the Q4 survey:
- The recent changes to interest rates have impacted the traffic of prospective homebuyers for CHBA members. 77% said that there has been less traffic as a result of increasing interest rates (up 20 percentage points since Q3 2022) and half of CHBA's membership indicated that buyers are delaying purchasing. 30% of CHBA's panel explained that buyers have even started changing their minds.
o Over half (55%) of builders said it is critical for their business that interest rates stop rising immediately so that more buyers return to the market. - In Q1 2022, we asked builders if they think their company will have as many housing starts in 2022 as it did in 2021 and 80% of builders said yes. After multiple interest rate hikes, we asked builders how they expect their 2023 housing starts to compare to 2022.
o 72% stated they expect to have fewer starts in 2023 than they did in 2022. On average, builders expect to have 43% fewer housing starts in 2023. - We asked CHBA members how far they are sold out in months into 2023. On average, members are sold out about 4 months into 2023. 31% of builders indicated they are not sold out into 2023 at all (I.e., 0 months).
- 59% of CHBA's expert panel indicated that the slowdown in the market is causing them to build fewer units (up 2 percentage points since Q3 2022) and 30% even said that it is causing them to cancel projects (up 6 percentage points since Q3 2022).
o Given this slowdown in the market, 14% of builders have already started layoffs. However, half of the respondents indicated that they are not expecting to lay off staff at this time, or at least not until after 2023.
o On the positive side, the slowdown in the market has been improving access to trades according to 43% of CHBA's panel. 36% even said that the slowdown is improving access to materials. - Overall, almost half of the respondents indicated that they are somewhat concerned regarding their business in 2023 and 16% said they are extremely concerned.
- 66% of CHBA members said that their lumber costs went up by more than $20,000 (down 13 percentage points since Q3 2022) and 31% of respondents indicated that their costs increased by more than $40,000. National average construction costs for lumber on a 2,400 sq ft home are up $29,616, down 21 percentage points since Q3 2022. This is the first major decline in lumber costs since we started this survey in Q1 2021. The highest average cost increase was found to be in New Brunswick (at $44,311) and in Nova Scotia (at $33,662).
- We also asked our panelists about the increase in their construction costs as a result of higher prices for other materials (outside of lumber). About 81% of respondents said that their costs have gone up by more than $20,000 (down 4 percentage points since Q3 2022).
o National average construction cost increases for a 2,400 sq ft home are $41,623, down 7% since Q3 2022. This is the first decline since Q1 2021. - Supply chain issues continue to be a challenge for CHBA's membership.
o In terms of serious shortages, appliances have now been replaced by garage doors as the most impacted product. - On average, supply chain issues have resulted in 10 weeks in delays in home completions for builders across Canada. The average delay is down one week since Q3 2022. The highest average delay was once again reported by CHBA members in Manitoba at 12 weeks (down 5 weeks since Q3 2022).
- Price volatility, supply chain issues and labour shortages have caused 61% of builders/developers to delay some pre-sales and/or development. This number is down 8 percentage points since Q3 2022.
- 78% of CHBA members explained that with respect to trades, prices are up. This number is down 6 percentage points since Q3 2022. 62% of respondents also stated that access to trades is causing construction delays.
- On average, the cost of labour/trades has gone up 28%, compared to prior to the pandemic, unchanged from the previous quarter. The highest average labour cost increase was in Nova Scotia (up 31%) and in British Columbia (up 30%).
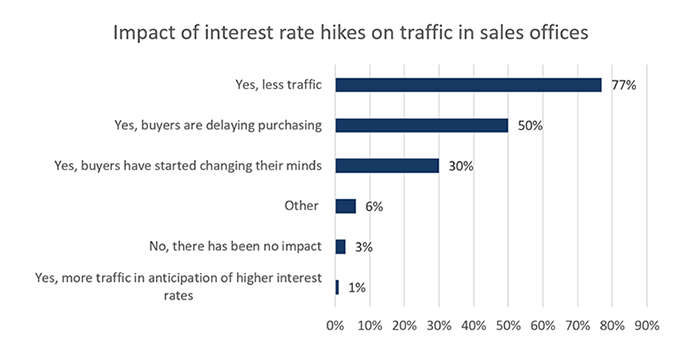
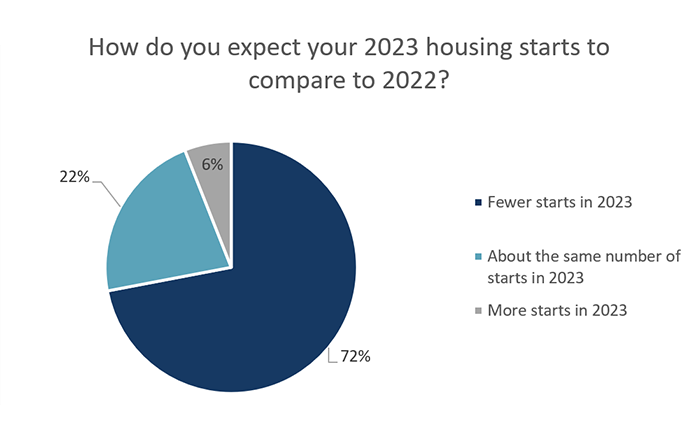
.png)
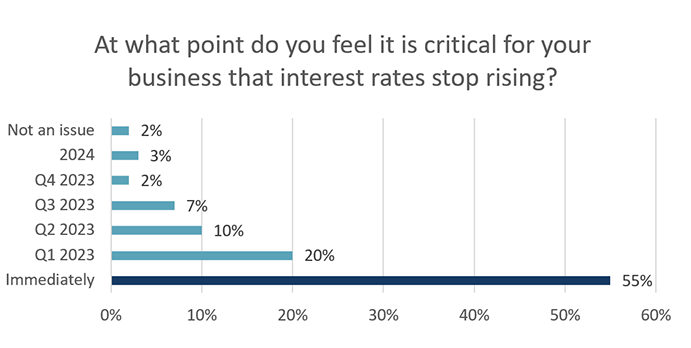
.png)
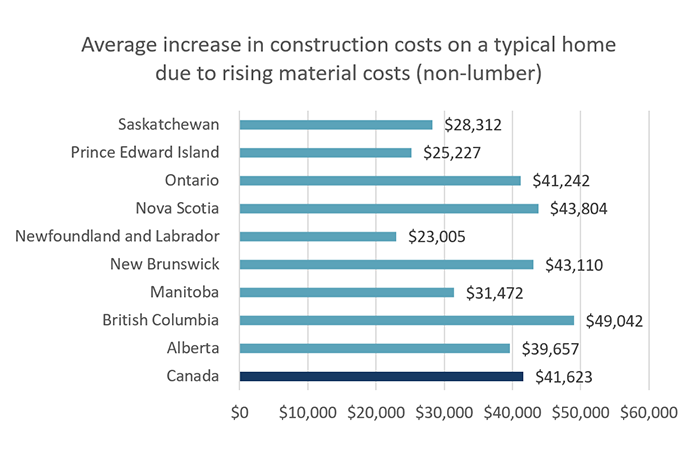
.png)
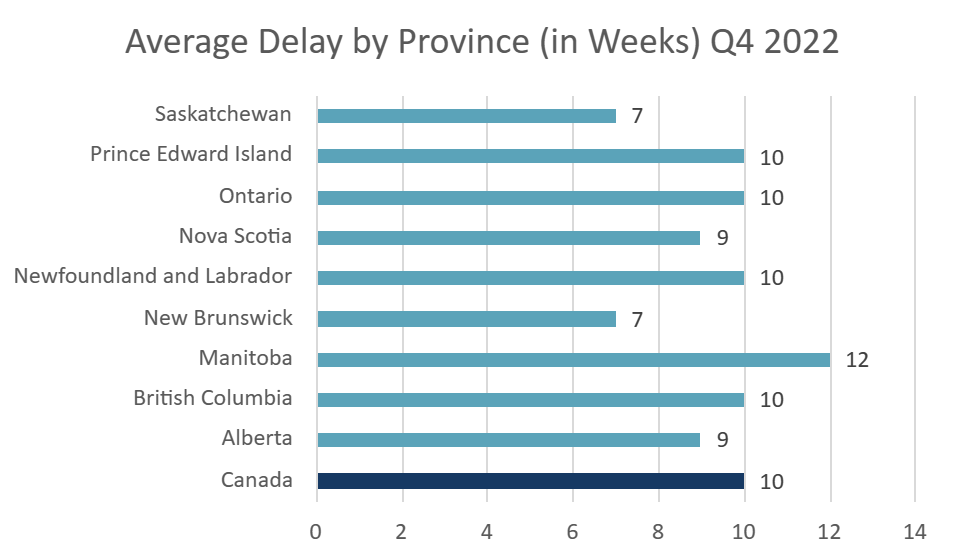
.png)
- The CHBA HMI for single-family builders was 43.4 in Q3 2022. This is the second major decline in builder sentiment this year. The single-family HMI is down 22.3 points since Q2 2022 and down 34.4 points since Q3 2021.
- 93% of single-family builders say home sales are slowing.
- 30% of single-family builders rated current conditions as Good (down from 59% in Q2 2022) while almost half (46%) rated future conditions as Fair (unchanged from the previous quarter).
o About half of the builders in British Columbia and the Prairie Provinces rated current conditions as Fair, while 54% of the builders in Ontario rated current conditions as Poor.
o In the Atlantic Region, most builders selected a Good rating for current conditions. - Only 7% of single-family builders rated the traffic of prospective homebuyers to be High to Very High. This is down 17 percentage points since Q2 2022. Almost half of the HMI panel (46%) rated the traffic of prospective homebuyers to be Low to Very Low.
o In Ontario, 79% of respondents rated the traffic of prospective homebuyers to be Low to Very Low.
.png)
.png)
.png)
- The CHBA HMI for multi-family builders was 35.9 in Q3 2022. Multi-family sentiment is down 24 points since Q2 2022 and down almost 42 points since Q3 2021.
- 92% of single-family builders say home sales are slowing.
- 20% of multi-family builders rated current conditions as Good (down 27 percentage points since Q2 2022) while 44% rated future conditions as Fair (up 1 percentage point).
- Only 5% of multi-family builders indicated that they expect the traffic of prospective homebuyers to be High to Very High (down 16 percentage points since Q2 2022).
o Almost all of the regions were most likely to select a Low to Very Low rating, apart from the Atlantic Region, where more multi-family builders rated conditions as Average. - Over half of the multi-family builders (54%) rated the traffic of prospective homebuyers to be Low to Very Low (up 29 percentage points since Q2 2022).
.png)
.png)
.png)
In addition to the survey questions that help develop the HMI, CHBA included additional “special questions” to ask the expert panel. These special questions allow us to better understand the results of the HMI and gain insights into other industry issues. The following are some of the findings from the special questions in the Q3 survey:
- Many builders highlighted that the recent and upcoming interest rate changes impacted the traffic of prospective homebuyers in their sales offices. 61% of builders indicated that buyers are delaying purchasing (up 16 percentage points since Q2 2022) and 57% said that there has been less traffic as a result of increasing interest rates. 36% of CHBA's panel explained that buyers have even started changing their minds.
- 55% of CHBA's expert panel indicated that the slowdown in the market is causing them to build fewer units and 24% even said that it is causing them to cancel projects.
- In Q1 2022, we asked builders if they think their company will have as many housing starts in 2022 as it did in 2021. 80% of builders said yes, but after multiple interest rate hikes only 45% of builders still believe they will have as many housing starts this year as they did last year (down 35 percentage points in only two quarters).
- Of those builders that say they will have fewer housing starts, 84% say it is as a result of rising interest rates.
- 55% of builders indicated that the overall supply of developed lots in their area is Low to Very Low.
- Total construction costs for lumber and other products materials on a 2,368 sq. ft. home are up $81,445 since prior to the pandemic.
- Almost 79% of CHBA members said that their lumber costs went up by more than $20,000 (unchanged since Q2 but up 11 percentage points since Q3 2021) and 40% of respondents indicated that their costs increased by more than $40,000 as a result of surging lumber prices (up 5 percentage points since Q2 2022 and up 15 percentage points since Q3 2021). National average construction costs for lumber for a 2,367 sq ft home are up $37,078. This is 3% higher than the Q2 2022 survey. The highest average cost increase was found to be in British Columbia (at $40,322) and in Ontario ($39,956).
- We also asked our panelists about the increase in their construction costs as a result of higher prices for other materials (outside of lumber). About 85% of respondents said that their costs have gone up by more than $20,000 (up 3 percentage points since Q2 2022 and up 51 percentage points since Q3 2021).
- National average construction cost increases (not including lumber) for a 2,367 sq ft home are $44,347, up 6% since Q2 2022. Cost increases were highest in British Columbia (up $51,308) and in Nova Scotia (up $48,522).
- Appliances continue to be the number one most impacted product, followed by windows.
- On average, supply chain issues have resulted in almost 11 weeks in delays in home completions for builders across Canada. The average delay is up one week since Q2 2022 and up four weeks since Q3 2021. The highest average delay was reported by CHBA members in Manitoba at 17 weeks.
- Price volatility, supply chain issues and labour shortages have caused 69% of builders/developers to delay some pre-sales and/or development.
- 84% of CHBA members explained that with respect to trades, prices are up. 69% respondents indicated that access to trades is difficult and 68% reported that access to trades is causing construction delays.
- On average, the cost of labour/trades has gone up 28%, compared to prior to the pandemic (up 2 percentage points since Q2 2022). The highest average labour cost increase was in Nova Scotia (up 36%) and in Prince Edward Island (up 32%).
.png)
.png)
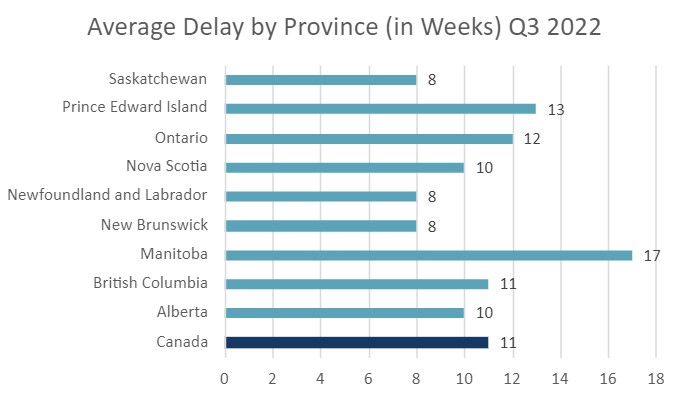
.png)
.png)
.png)
- The CHBA HMI for single-family builders was 65.7 in Q2 2022, declining by almost 24 points since Q1 2022 and by 17.2 points since Q2 2021.
- This is the second time the single-family HMI declined since CHBA launched the HMI in Q1 2021. Previously, in Q3 2021, the decline reflected challenges with the supply chain and labour, but the HMI had rebounded in Q4 2021 and climbed further in Q1 2022. The current Q2 drop can therefore be seen as a direct result of increasing interest rates, added on top of pre-existing challenges.
- Only 24% of single-family builders rated the traffic of prospective homebuyers to be High to Very High. This number is down 45% since Q1 2022.
- Despite the overall dramatic drop in the HMI and its likely implications, the majority (59%) of single-family builders rated current conditions as Good while almost half (46%) rated future conditions as Fair.
.jpg)
.jpg)
.jpg)
- The CHBA HMI for multi-family builders was 59.9 in Q2 2022, declining by almost 29 points since Q1 2022 and by 24 points since Q2 2021.
- As with the single-family builders, the Q2 decline reflects the uncertainty around certain aspects of the housing market including interest rate changes and supply chain issues.
- Only 21% of multi-family builders indicated that they expect the traffic of prospective homebuyers to be High to Very High. This is down 49% since Q1 2022.
- 25% of multi-family builders expect traffic to be Low to Very Low. This is up 22% since Q1 2022.
- About half (47%) of multi-family builders rated current conditions as Good while 43% rated future conditions as Fair.
.jpg)
.jpg)
.jpg)
In addition to the survey questions that help develop the HMI, CHBA included additional “special questions” to ask the expert panel. These special questions allow us to better understand the results of the HMI and gain insights into other industry issues. The following are some of the findings from the special questions in the Q2 survey:
- Many builders highlighted that the recent and potentially upcoming interest rate changes have significantly impacted the traffic of prospective homebuyers in their sales offices. 50% of respondents indicated that there has been less traffic and 45% said that buyers are delaying purchasing. 38% of CHBA's panel explained that buyers have even started changing their minds.
- 93% of respondents indicated that the increased cost of lumber continues to be an issue, highlighting that this is a challenge across the board for CHBA’s membership.
- Almost 79% of CHBA members said that their lumber costs went up by more than $20,000 (down 5% since Q1) and 35% of respondents indicated that their costs increased by more than $40,000 as a result of surging lumber prices. National average construction costs for a 2,484 sq. ft. home are up $36,011. This is 9% lower than the Q1 2022 survey. The highest average cost increase was found to be in Prince Edward Island and Manitoba.
- Many builders have started substituting certain materials due to the continuously rising prices. Out of the respondents who have started substituting materials, 23% have started substituting insulated concrete forms and composite materials.
- We also asked our panelists about the increase in their construction costs as a result of higher prices for other materials (outside of lumber). About 82% of respondents said that their costs have gone up by more than $20,000. The national average construction cost increases for a 2,484 sq. ft. home are $41,772, up 5% since Q1 2022. Nova Scotia's cost increase was highest, at $47,933.
- Combining lumber and other material price increases, the national average construction cost increase for a 2,484 sq. ft. home is up $78,000 per unit, 46% of that being from lumber and 54% being from other products and materials.
- Overall, the panelists outlined several key challenges due to supply chain issues. Appliances continue to be the number one most impacted product, followed by plumbing materials and plumbing fixtures.
- On average, supply chain issues have resulted in almost 10 weeks in delays in home completions for builders across Canada. The average delay is unchanged since Q1 2022. The highest average delay was reported by CHBA members in Manitoba at 14 weeks. About half of respondents indicated that supply chain issues have resulted in over 9 weeks in delays.
- Price volatility, supply chain issues and labour shortages have caused 68% of builders/developers to delay some pre-sales and/or development. This number is up 3% since Q1 2022.
- About 89% of CHBA members explained that with respect to trades, prices are up. This number is down 3% since Q1 2022. 72% indicated access to trades is causing construction delays and 66% noted that access to trades is difficult.
- On average, the cost of labour/trades has gone up 26%, compared to prior to the pandemic. This is 1% higher than in Q1 2022. The highest average cost increase was found to be in Prince Edward Island, at 31%.
- Builders are also experiencing roadblocks between application and issuance for a building permit; 29% indicated it can take up to more than 9 weeks.
- 64% of builders indicated that the overall supply of developed lots in their area is Low to Very Low (up 1% since Q4 2021). Only 4% of builders said that the overall supply of developed lots in their area is High to Very High.
.jpg)
.jpg)
.jpg)
.jpg)
.jpg)
- The CHBA HMI for single-family builders was 89.4 in Q1 2022, increasing by 6.2 points since Q1 2021 and by 4.5 points since Q4 2021.
- This reflects strong builder confidence and is a result of continuously increasing demand for single-family homes since the onset of the pandemic. The single-family HMI reached its all-time high in Q4 2021, but that record has now been surpassed as the single-family HMI in Q1 2022 at 89.4 is now the highest since the HMI was launched in Q1 2021.
- The majority of single-family builders rated current and future conditions as Good (87% and 80%, respectively). This is prevalent across all regions, especially in the Atlantic Region, where none of the builders selected a Poor rating.
- Since Q1 2021, the single-family HMI is up 7%. The number of respondents rating current and future conditions positively increased during the year, with 10% more respondents selecting a Good rating for current conditions and 7% more respondents selecting a Good rating for future conditions. 32% and 21% more respondents from the Prairie Provinces and the Atlantic Region (respectively) selected a Good rating for current conditions, compared to Q1 2021, indicating that conditions have improved significantly in the past year in these two regions.
- 69% of single-family builders rated the traffic of prospective homebuyers to be High to Very High. In the Atlantic Region and British Columbia, 86% and 80% of respondents (respectively) rated conditions to be High to Very High. Last quarter, the Prairie Provinces were the only region to be most likely to select an Average rating. This quarter all of the regions were most likely to select a High to Very High rating. Between Q4 2021 and Q1 2022, 16% more builders rated the traffic of prospective homebuyers to be High to Very High.
- Since Q1 2021, 6% more single-family builders rated the traffic of prospective homebuyers as High to Very High and the number of respondents who rated traffic to be Low to Very Low is down 8%. The number of respondents that selected a High to Very High rating in the Prairie Provinces and the Atlantic Region is up 25% and 21%, respectively.

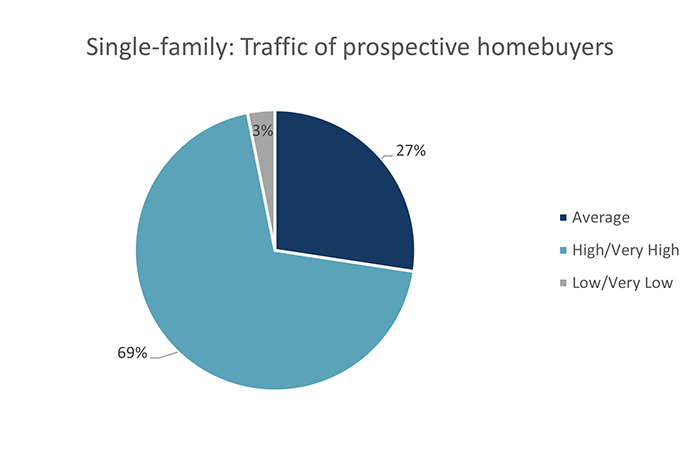
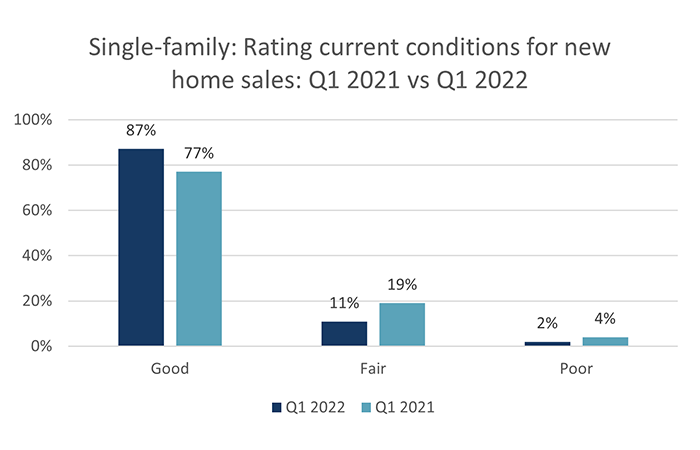
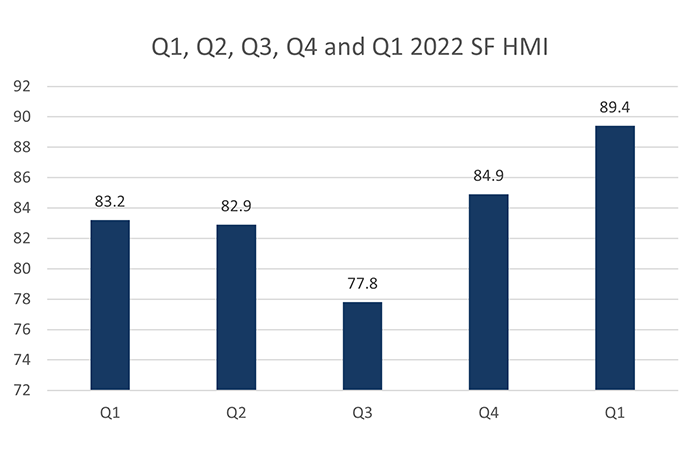
- The CHBA HMI for multi-family builders was 88.8 in Q1 2022. This is up 2% since Q4 2021.
- At the onset of the pandemic, the condo market softened slightly as more Canadians elected to live in bigger spaces outside of the urban cores. With the vaccine rollout and generally better economic conditions, the condo market started growing again and this is reflected in the HMI.
- The majority of multi-family builders rated both current and future conditions as Good (86% and 79%, respectively).
- Since Q1 2021, the multi-family HMI is up 9%. The number of respondents rating current and future conditions positively increased during the year, with 8% more respondents selecting Good for current conditions and 6% more respondents selecting Good for future conditions. 56% more respondents from the Prairie Provinces selected a Good rating for current conditions, compared to Q1 2021, indicating that conditions have improved significantly in the past year in this region.
- 70% of multi-family builders expect the traffic of prospective homebuyers to be High to Very High. This is up 17% since Q4 2021. As was observed in Q4 2021, the Prairie Provinces continue to be the only region to be most likely to select an Average rating. Interestingly, none of the multi-family builders in the Prairie Provinces selected a Low to Very Low rating.
- About 3% of multi-family builders expect traffic to be Low to Very Low. This is down 4% since Q4 2021.
- Since Q1 2021, 14% more multi-family builders rated the traffic of prospective homebuyers Good and the number of respondents who rated traffic to be Low to Very Low is down 12%. The number of respondents that selected a High to Very High rating is up for all the regions since Q1 2021. In the Prairie Provinces, there are now 33% more respondents rating traffic as High to Very High compared to Q1 2021.
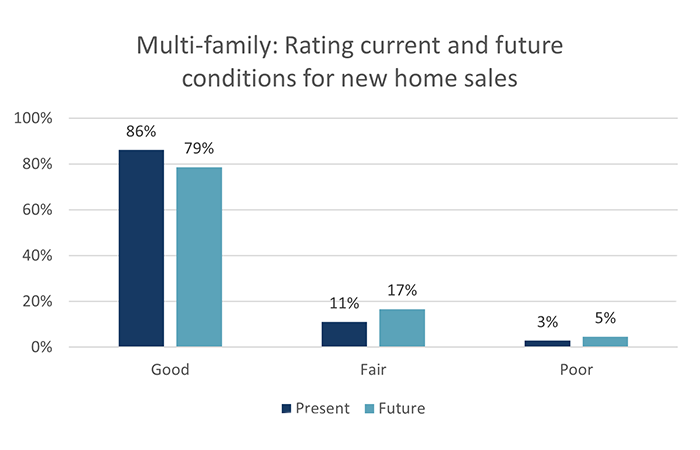


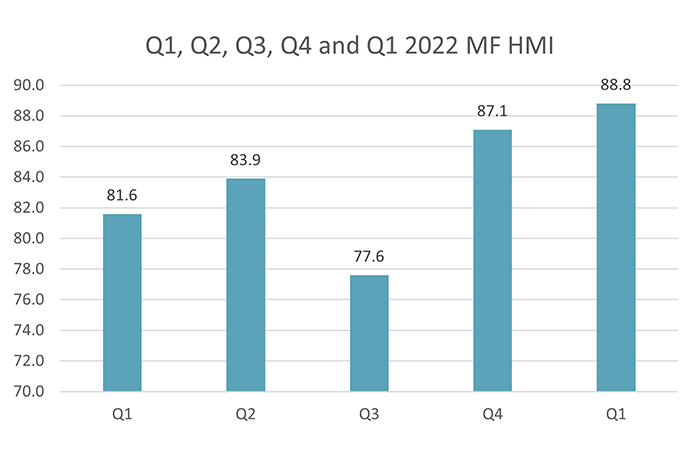
In addition to the survey questions that help develop the HMI, CHBA included additional “special questions” to ask the expert panel. These special questions allow us to better understand the results of the HMI and gain insights into other industry issues. The following are some of the findings from the special questions in the Q1 survey:
- Since 2021 was a banner year for housing starts across the country, we asked CHBA's expert panel whether they expect they will have as many housing starts in 2022 as they did in 2021. 80% of respondents said they expect to have as many housing starts in 2022 as they did last year. Of the 20% that said they do not think they will have as many housing starts as they did, 68% of them indicated that it is due to permitting/approval delays, 67% said it is due to construction cost volatility, and 61% said it is due to land availability.
- 96% of respondents indicated that the increased cost of lumber continues to be an issue, highlighting that this is a challenge across the board for CHBA’s membership.
- Almost 84% of CHBA members said that their lumber costs went up by more than $20,000 (up 12% since Q4) and 46% of respondents indicated that their costs increased by more than $40,000 as a result of surging lumber prices (up 11% since Q4). National average construction cost for a 2,475 sq ft home are up $39,611. This is 16% higher than what was reported in the Q4 survey. The highest average cost increase was found to be in Saskatchewan and Manitoba.
- Overall, 94% of builders have increased the price of homes as a result of increasing lumber prices (up 10% since Q2 2021) and 59% of respondents have started ordering/securing prices as far in advance as possible (down 13% since Q2 2021). These continue to be the top two actions taken by CHBA members since Q2 2021.
- Year-over-year, the average increase in construction costs on a typical home due to rising lumber costs has doubled. In Q1 2021, only 36% of panelists said that their costs have gone up by over $20,000. In Q1 2022, this number has increased significantly, to 84% of respondents indicating the same.
- Most respondents explained that structural wood products (e.g., I-joists) have been difficult to access, followed by OSB. This order remains unchanged since Q3 2021, however, 18% fewer respondents (for a total of 40% of respondents) selected structural wood products, and 43% of respondents said they are not having issues at all in accessing lumber products (up 16%). This suggests access to structural wood products has been improving, though some experts are predicting access becoming more difficult again as the year unfolds. Regionally, access to lumber products (specifically dimensional lumber, other structural wood products and plywood) continues to be an issue for many provinces but builders in Ontario were more likely to cite this as a concern.
- We also asked our panelists about the increase in their construction costs as a result of higher prices for other materials (outside of lumber). About 84% of respondents said that their costs have gone up by more than $20,000, which is 14% higher than in Q4 2021. The national average construction cost increases for a 2,475 sq ft home are $39,706. British Columbia's cost increase was highest, at $46,109. In Q1 2021, most of the respondents (38%) indicated that their costs have increased by less than $5,000. In Q1 2022, the complete reverse happened as now 41% of respondents said that their costs have gone up by more than $40,000.
- Combining lumber and other material price increases, the national average construction cost increase for a 2,475 sq. ft. home is up $80,000 per unit.
- Overall, the panelists outlined several key challenges due to supply chain issues. Appliances are now most impacted, followed by garage doors and bathtubs, showers and sinks. Respondents indicated that these products have a serious shortage. Respondents were also asked to indicate where there are products and services with some shortage (rather than a serious shortage). In this case, plumbing materials and plumbing fixtures were in first place, followed by flooring and electrical materials and light fixtures. Since Q1 2021, appliances have continued to be the most impacted product by supply chain issues.
- On average, supply chain issues have resulted in almost 10 weeks in delays in home completions for builders across Canada. The average delay is up 3% since Q4 2021. The highest average delay was reported by CHBA members in Prince Edward Island at 16 weeks. Most of the provinces posted higher delays in Q1 2022 compared to Q4 2021 except for New Brunswick, Newfoundland and Labrador, Ontario and Saskatchewan.
- Delays in home completions due to supply chain issues have clearly become a significantly bigger issue since Q1 2021. Between Q1 2021 and Q1 2022, 41% more respondents indicated that home completions are now being delayed by more than 9 weeks. The average delay is up 4 weeks since Q1 2021.
- Price volatility, supply chain issues and labour shortages have caused 65% of builders/developers to delay some pre-sales and/or development. This number is up 1% since Q4 2021.
- About 92% of CHBA members explained that with respect to trades, prices are up. This number is up 7% since Q4 2021. 71% indicated access to trades is causing construction delays (unchanged since Q4 2021), and 63% noted that access to trades is difficult (3% lower than in Q4 2021). Several respondents indicated that there is a major shortage of framers at the moment. Since Q1 2021, the order of the responses regarding trades is unchanged. However, 13% more respondents selected "prices are up" and 26% more respondents selected "access to trades is causing construction delays" in Q1 2022 compared to Q1 2021.
- On average, the cost of labour/trades has gone up 25%, compared to prior to the pandemic. This is 5% higher than in the Q4 survey. The highest average cost increase was found to be in Prince Edward Island, at 33%. All of the provinces posted increases since Q4 2021, except for Newfoundland and Labrador where the average cost of labour has gone down by 10% since the last quarter.
- Over half (53%) of panelists explained that they are training existing employees to take on more responsibilities to address labour shortage challenges in the sector. This was followed by offering incentives and better employee benefits to new staff (42%) and offering flexible work arrangements (40%).
- We asked CHBA members why they are finding it difficult to hire new talent and 77% of them indicated that it is because there are not enough candidates. This was followed by lack of experience and lack of hard skills.
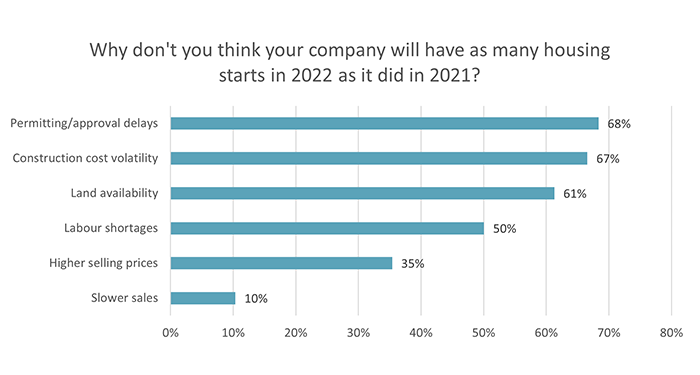
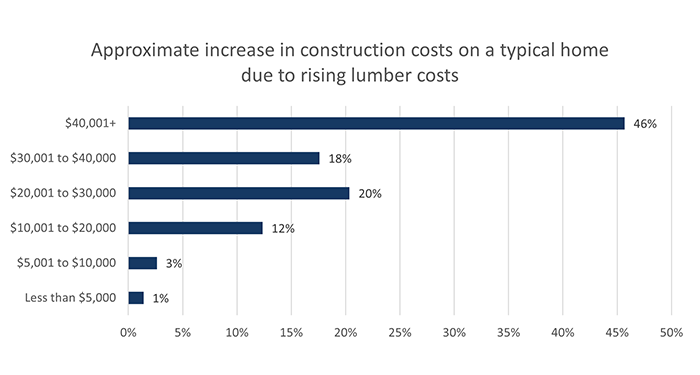
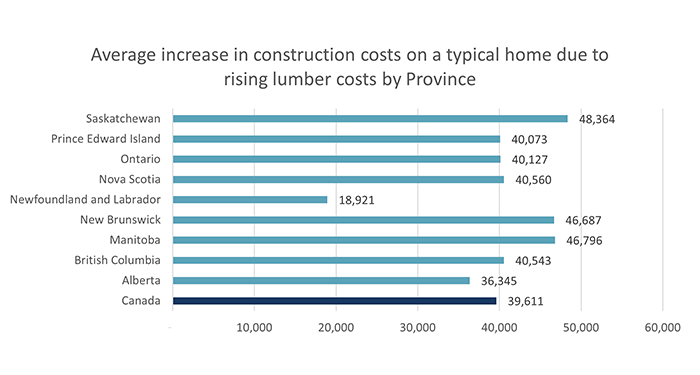
.png)
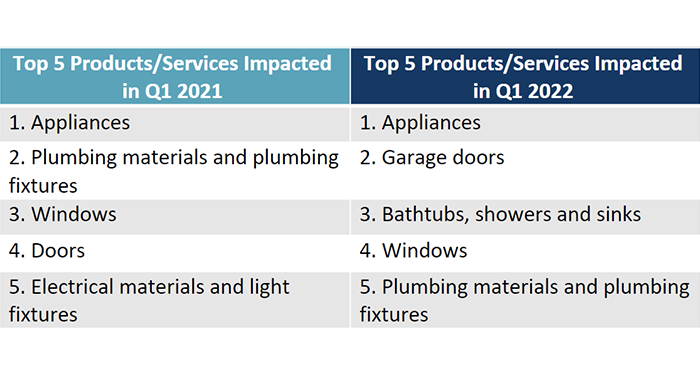
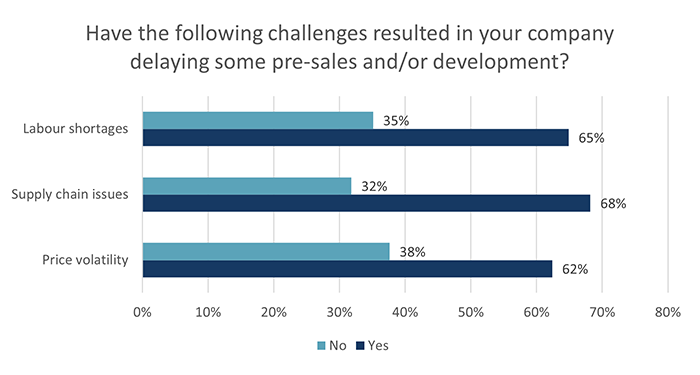
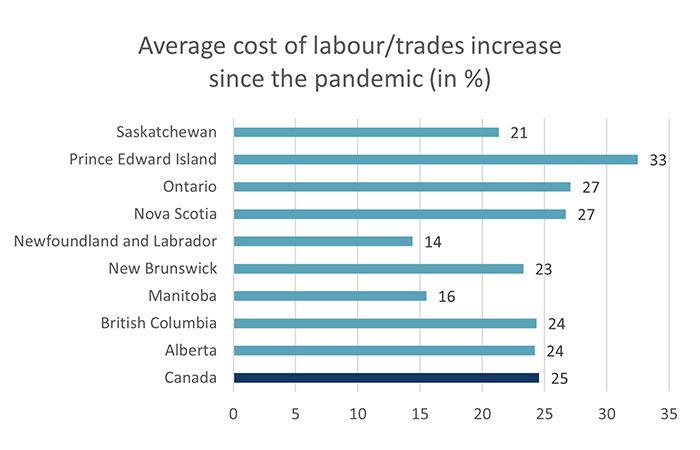

- The CHBA HMI in the single-family market was high in Q4 2021, at 84.9, increasing by 1.7 points since Q1 2021 and by an astounding 7.1 points since Q3 2021.
- This illustrates strong builder confidence in Canada due to the increased demand for single-family homes over the past year and continued strength into the fourth quarter. Throughout the year, quarter-to-quarter sentiment was declining due to a number of uncertainties in the housing market. But sentiment is on the rise again as some of the uncertainties that were present throughout the year have been reduced, and the market adjusts to persistent higher material prices, longer build times, but continued consumer demand. The likely increase to interest rates in 2022 may also be pulling forward activity.
- The majority of single-family builders rated current and future conditions as Good (84% and 76%, respectively). This is prevalent across all regions, especially in the Atlantic Region and British Columbia, where none of the builder panelists selected a Poor rating. All of the regions were most likely to select a Good rating for both present and future conditions. Looking at the next six months, none of the respondents from Ontario and British Columbia selected a Poor rating. Comparing the Q3 and Q4 data, about 11% more builders rated current conditions as Good, reflecting a re-strengthening in the market towards the end of the year.
- Nationally, 53% of single-family builders rated the traffic of prospective homebuyers to be High to Very High. In British Columbia and Ontario, 63% and 61% of respondents (respectively) rated conditions to be High to Very High. Between Q3 and Q4, 11% more builders rated the traffic of prospective homebuyers to be High to Very High. The Prairie Provinces (especially respondents in Alberta) were most likely to select an Average rating and about 10% of the respondents in the Prairies rated the traffic of prospective homebuyers to be Low to Very Low.
- We asked the respondents who selected a High to Very High or Average rating to provide more insights and we found that 77% of builders attribute the traffic of prospective homebuyers to high demand for new construction, reflective of the market that has evolved through the pandemic. This number is up 9% since Q2 2021.
- Only 7% of builders noted traffic to be low, but of those, 64% of the respondents indicated that supply chain issues are causing significant delays in home completions. Interestingly, when we compare the Q4 and Q2 surveys, 26% fewer respondents expect lumber and other materials prices to continue rising over the coming months. This is consistent with the Bank of Canada expectation that we are currently peaking at supply chain issues, which should start to come back to normal over the course of 2022.
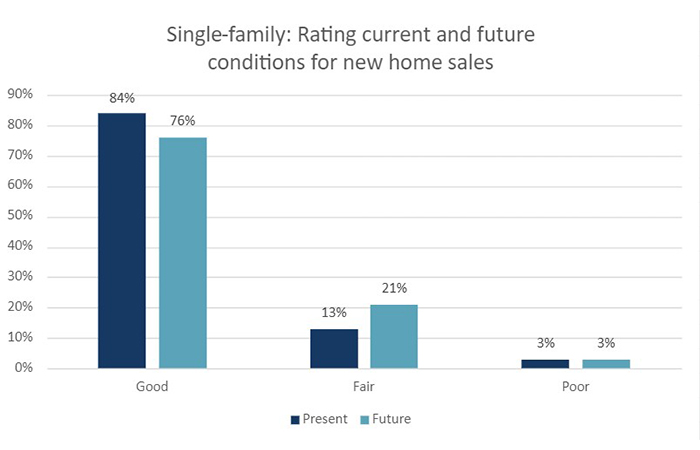
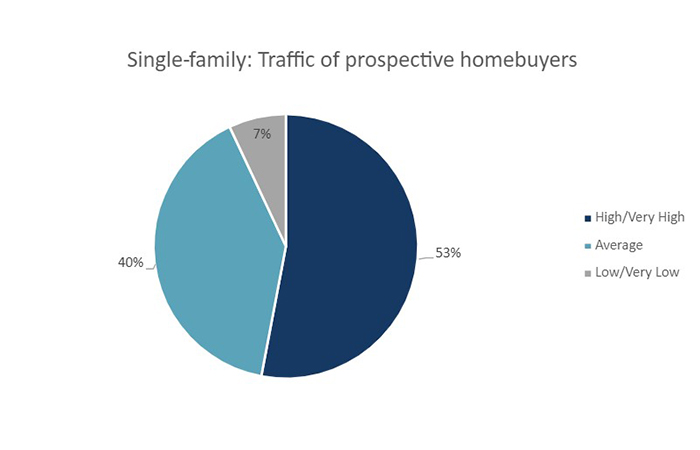
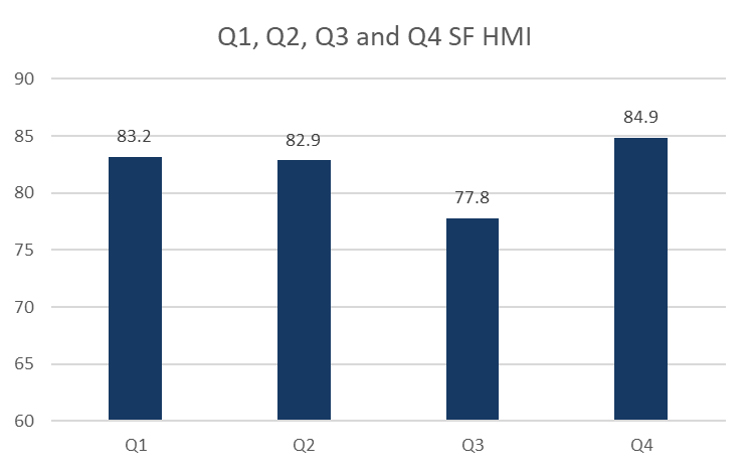
- The CHBA HMI for multi-family builders was 87.1 in Q4 2021. This is up 7% since Q1 2021 and up 12% since Q3 2021. This is an extremely strong HMI score.
- This strong sentiment number can be attributed to a growing condo market in 2021 and into 2022. Apartment housing starts have been continuously growing throughout the year and have grown by 31% between November 2020 and November 2021.
- The majority of multi-family builders rated both current and future conditions as Good (86% and 72%, respectively). As with the single-family builders, about 14% more multi-family builders rated current conditions as Good and about 9% more builders rated future conditions as Good in Q4 2021. In British Columbia and the Atlantic Region, none of the builders selected a Poor rating (for both current and future conditions).
- 63% of multi-family builders expect the traffic of prospective homebuyers to be High to Very High. This is up a dramatic 25% since Q3 2021. This was especially the case British Columbia where 77% of the multi-family builders expect traffic to continue to be very high (as it has been over the past year). The Prairie Provinces were the only region to most likely select an Average rating and about 24% of the respondents in this region rated conditions as Low to Very Low.
- For the 93% of builders with positive sentiment (i.e., having rated traffic as either Average or High to Very High): 77% of builders attribute the traffic of prospective homebuyers to house prices rising across the country (up 17% since Q3 2021).
- For the 7% of builders with negative sentiment (i.e., having rated traffic as Low to Very Low), 29% of the respondents indicated that supply chain issues are causing significant delays in home completions. This is up 11% since Q2 2021. Slowing home sales and the expectation that lumber and other materials prices will continue rising were the other top reasons for lower sentiment.
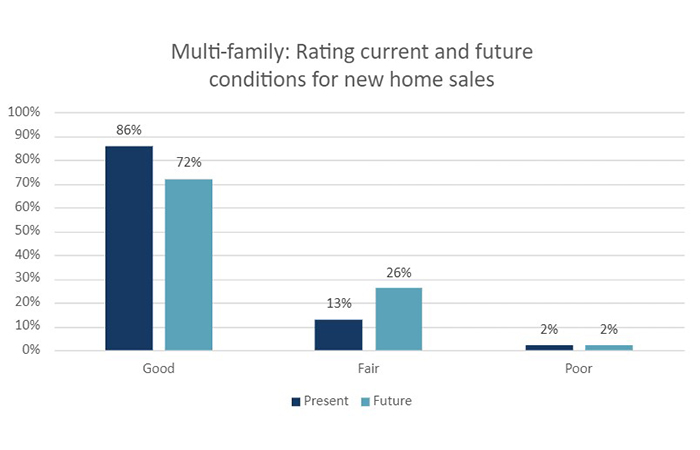
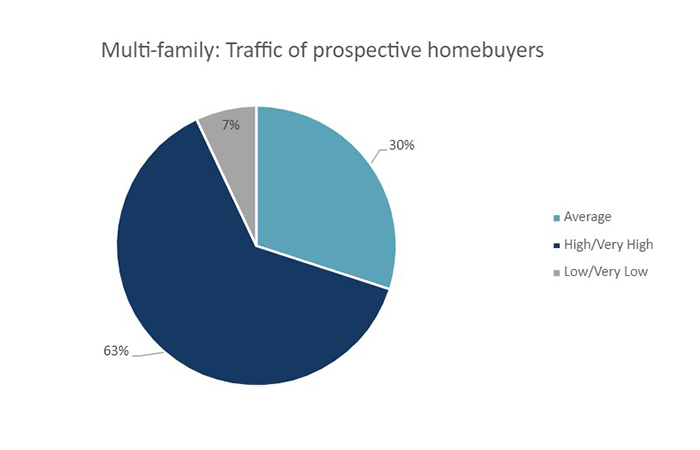
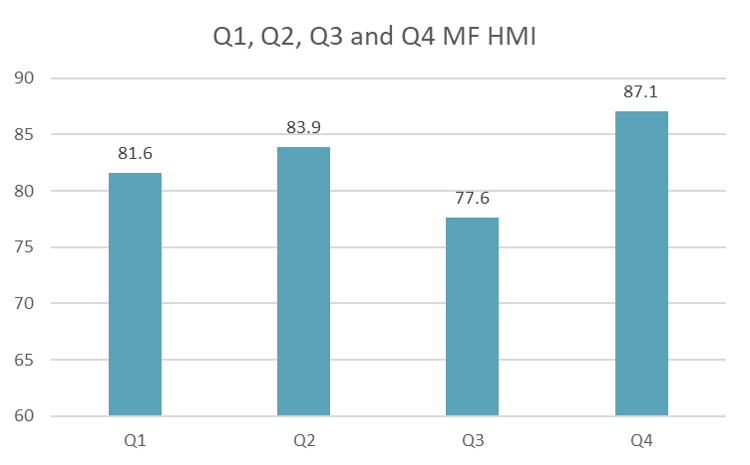
In addition to the survey questions that help develop the HMI, CHBA included additional “special questions” to ask the expert panel. These special questions allow us to better understand the results of the HMI and gain insights into other industry issues. The following are some of the findings from the special questions in the Q4 survey:
- 93% of respondents indicated that the increased cost of lumber continues to be an issue, indicating that this is a challenge across the board for CHBA’s membership.
- Almost 72% of the panelists said that their construction costs due to lumber went up by more than $20,000, and 35% of respondents indicated that their costs increased by more than $40,000 as a result of surging lumber prices. National average construction cost increase for a 2,482 sq. ft. home is $34,292 because of increased lumber prices. This is 1.8 times higher than when we conducted the survey in Q1 2021. The highest average cost increases were found to be in Prince Edward Island and Manitoba ($60,049 and $48,825, respectively).
- Lumber prices are typically guaranteed for 2 to 4 weeks, according to 35% of CHBA’s expert panel. But there is significant variability, including respondents that noted that there is no guarantee whatsoever in some cases.
- Beyond lumber, about 70% of respondents said that their construction costs as a result of rising material costs (outside of lumber) have gone up by more than $20,000, which is double what we saw in the Q3 survey. The national average construction cost increase for a 2,482 sq. ft. home is $33,768 due to non-lumber material price increases. Nova Scotia’s average cost increase was highest, at $41,373.
- Combining lumber and other material price increases, the national average construction cost increase for a 2,482 sq. ft. home is up $68,060 per unit (13% higher than what was reported in the Q3 survey).
- On average, supply chain issues have resulted in almost 10 weeks in delays in home completions for builders across Canada. The average delay is up by three weeks since the same question was asked in the Q3 survey. Almost half of respondents indicated that supply chain issues have resulted in over 9 weeks in delays. This is double the amount of people who said the same in the Q3 survey. The highest average delay was reported by CHBA members in Manitoba at 13 weeks. All provinces posted higher delays in Q4 than Q3 except for Newfoundland and Labrador.
- Overall, the panelists outlined several key challenges due to supply chain issues. Plumbing materials and plumbing fixtures are now the most impacted, followed by appliances and windows. For the past year, appliances had consistently been rated as number one product type being impacted, but they now move down to second place, though both are reported as an issue for over 80% of builders.
- 64% of respondents indicated that price volatility, supply chain issues or labour shortages have resulted in their company delaying some pre-sales and/or development. This number is up 21% since Q1.
- 63% of builders indicated that the overall supply of developed lots in their area is Low to Very Low. Only 4% of builders said that the overall supply of developed lots in their area is High to Very High. The NAHB also asked their members about lot supply and found that 76% of their builders reported that the overall supply was low to very low. The NAHB explained that this is an all-time record since they began collecting this information in the 1990s. Clearly this is a significant issue not only in Canada but also in the United States.
- Over 85% of respondents explained that with respect to trades, prices are up. 71% indicated access to trades is causing construction delays, and 66% noted that access to trades is difficult.
- On average, the cost of labour/trades has gone up 20%, compared to prior to the pandemic. This is 1% higher than in the Q3 survey. The highest average cost increase was found to be in Nova Scotia, at 25%.
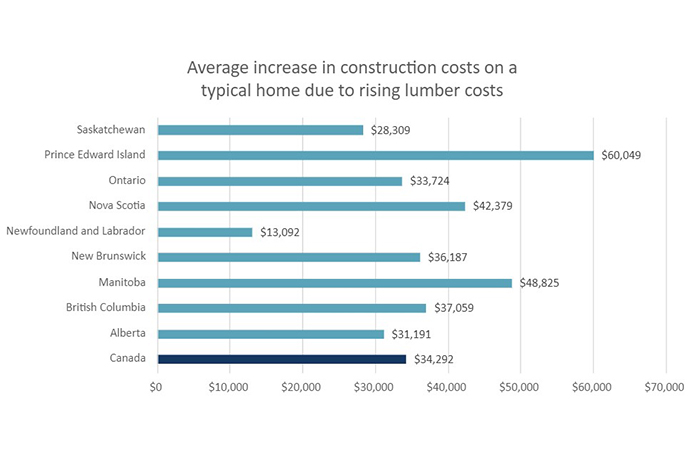
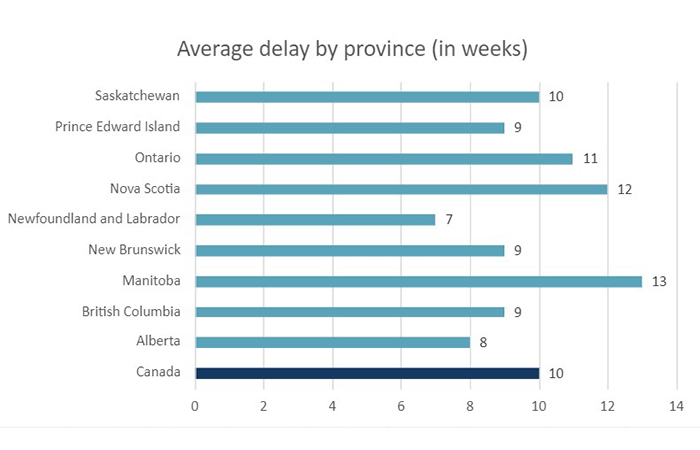
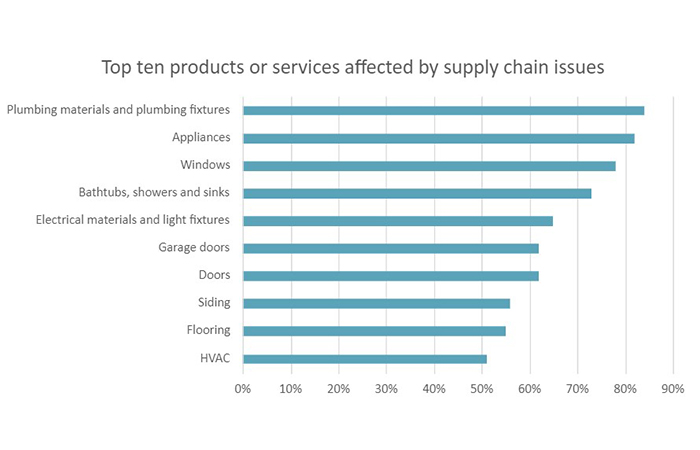
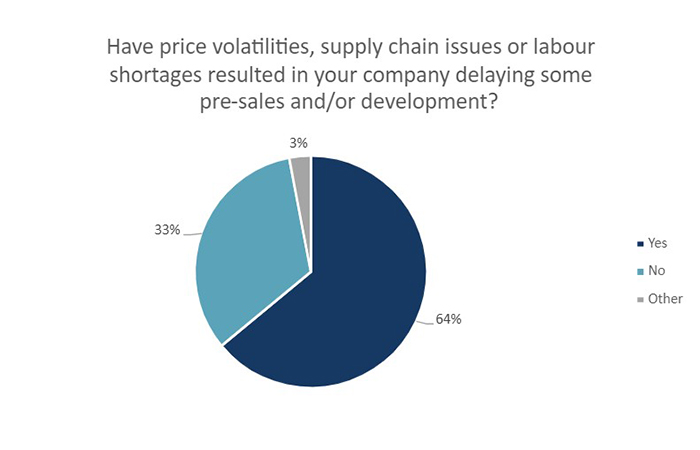
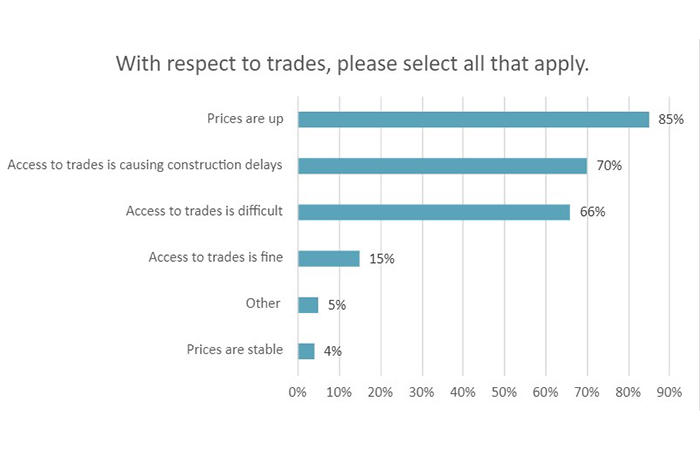
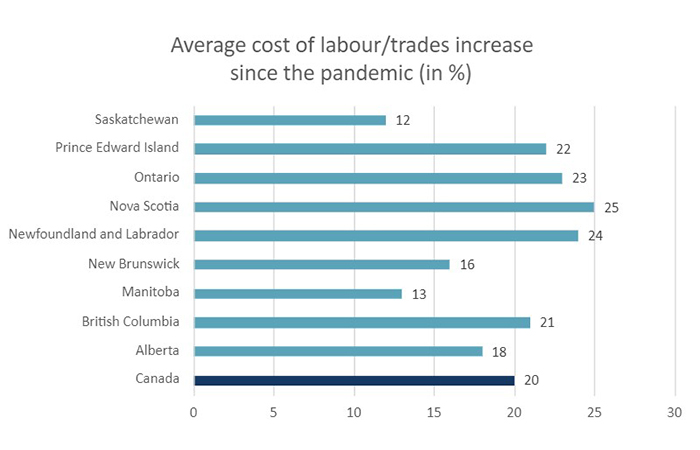
- The CHBA HMI shows that builder confidence in the single-family market was high in Q3 2021, at 77.8, though declining by 5.1 points since Q2 2021. In Q1 2021, the single-family HMI was 83.2, which is a 7% decline between the three quarters. Note that HMI numbers are not seasonally adjusted.
- While the drop is reflective of challenges with the supply chain and with labour, the still-reasonably-high HMI illustrates continued builder confidence in Canada due to the increased demand for single-family homes. A variety of factors are reflected in the quarter-to-quarter sentiment decline, including changes to the stress test, but also very much the impacts of the pandemic on the supply chain and labour. Supply chain issues are a continuing problem, as more than 55% percent of panelists said that they are delaying some pre-sales and/or development due to price volatility. On average, the higher cost of lumber has increased CHBA’s members’ costs on a typical home by $34,562. This is 1.8 times higher than when we conducted the survey in Q1 2021.
- Given the HMI uses a 100-point scale, 77.8 is a reasonably high sentiment number, reflecting strong builder confidence. As a comparator, NAHB’s single-family HMI (which is similar to CHBA’s) hit 90, a record high, in November 2020, but it fell to 76 in September 2021 as material and labour challenges persist.
- The majority of single-family builders rated current and future conditions as Good (73% and 59%, respectively). Comparing Q2 and Q3 data, in Q3 about 7% fewer builders rated current conditions as Good, reflecting a slight slowing of the market of record-pace, and the impact of the stress test on the market, which we discuss in more detail below.
- Forty-two percent of single-family builders rated the traffic of prospective homebuyers to be High to Very High, down 21% since we conducted the Q1 survey. Growth in investment in building construction, housing starts, building permits, home sales and home prices has been slowing in the past few months. However, all of these indicators recently reached incredible highs so a return to more typical levels of activity can be expected. A recent report by the Royal Bank of Canada indicated that housing starts over the past year have been their strongest since 1977 and the number of new housing units currently under construction is at an all-time high. And while sentiment appears to be declining slightly overall across Canada, in Ontario and the Atlantic Region over half of builders rated the traffic of prospective homebuyers to be High to Very High.
- We asked the respondents who selected a High to Very High or Average rating to provide more insights and we found that 74% of builders attribute the traffic of prospective homebuyers to high demand for new home construction, reflecting the market that has evolved through the pandemic as homebuyers seek more space and are able to move further from urban cores. This is up 6% since we conducted the Q2 survey.
- Only 13% of builders noted traffic to be low, but of those, 88% of the respondents noted that the traffic is indicative of home sales slowing. Seventy-three percent of respondents also explained that they selected a Low rating because supply chain issues are causing significant delays in home completions. This continues to be the second most popular response since the Q2 survey. Lumber and other material prices slipped from the number one issue in Q2 to number 3.
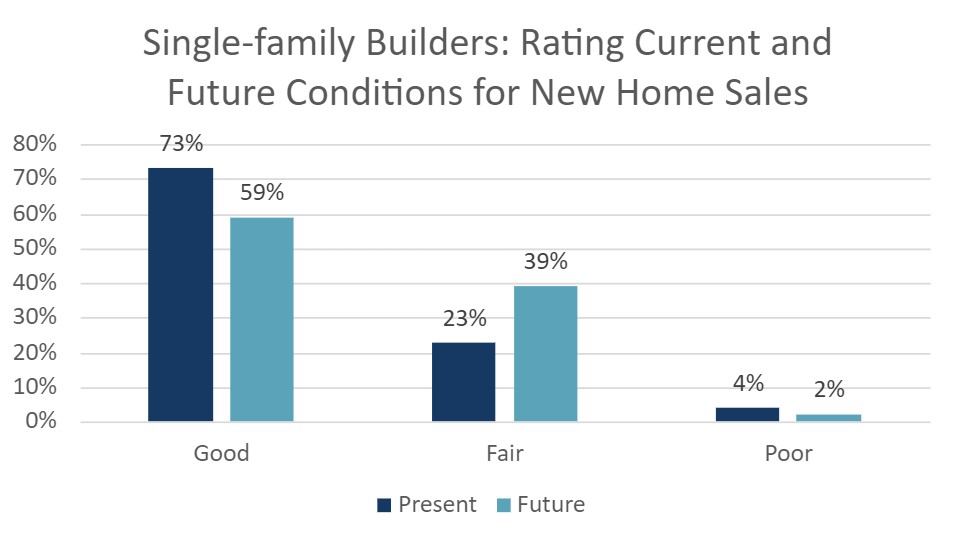
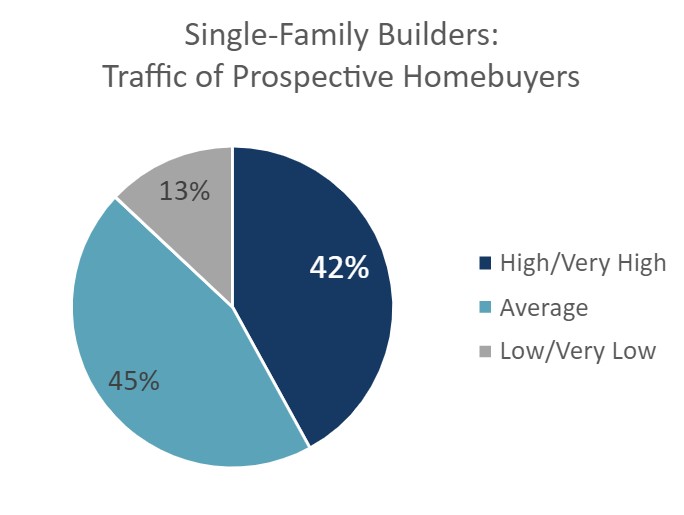
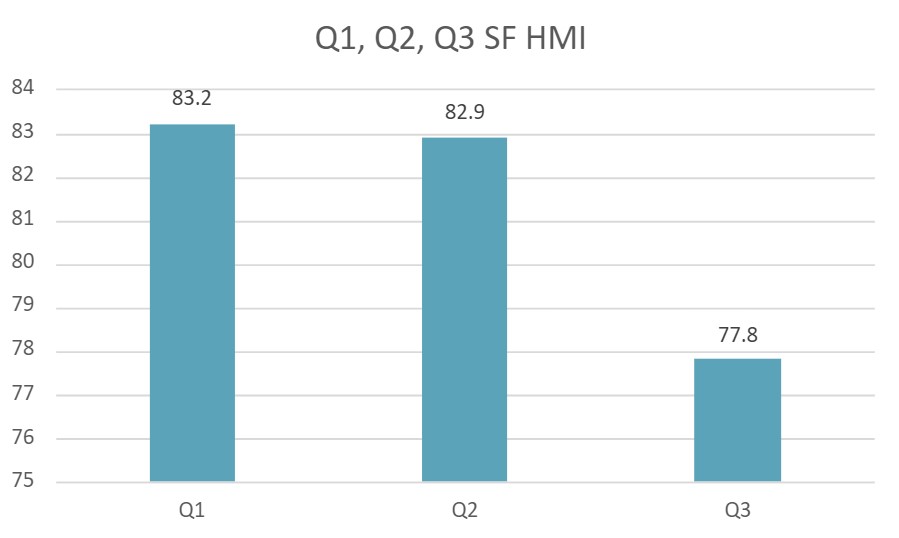
- The CHBA HMI for multi-family builders was 77.6 in Q3 2021, having started the year at 81.6 in Q1, then going up to 83.9 in Q2 with multi-unit activity growing as impacts of the pandemic on this part of the sector eased. The Q3 decline reflects the uncertainty around certain aspects of the housing market including supply chain issues. The stress test certainly also had an impact, as 32% of multi-family builders indicated that it had impacted their sales, with many panelists pointing to less qualified buyers which resulted in less sales.
- Nevertheless, 77.6 remains a strong sentiment number and can be attributed to an overall growing condo market in 2021.
- The majority of multi-family builders rated both current and future conditions as Good (72% and 63%, respectively). As with the single-family builders, about 7% fewer multi-family builders rated future conditions as Good in Q3 2021.
- Thirty-eight percent of multi-family builders indicated that the traffic of prospective homebuyers was High to Very High. This was especially the case in British Columbia where half of the multi-family builders expect traffic to continue to be very high (as it has been over the past year).
- We asked the respondents who selected a High to Very High or Average rating to explain why they selected this rating and we found that 71% of builders attribute the traffic of prospective homebuyers to high demand for new condo construction, which was originally slow during the COVID-19 pandemic but has accelerated in recent times. This is up 3% since we conducted the Q2 survey.
- Of the 10% of builders who ranked prospective homebuyers as low, 56% of builders noted that the traffic of prospective homebuyers is currently low because supply chain issues are causing significant delays in home completions. This is up an astounding 38% since Q2.
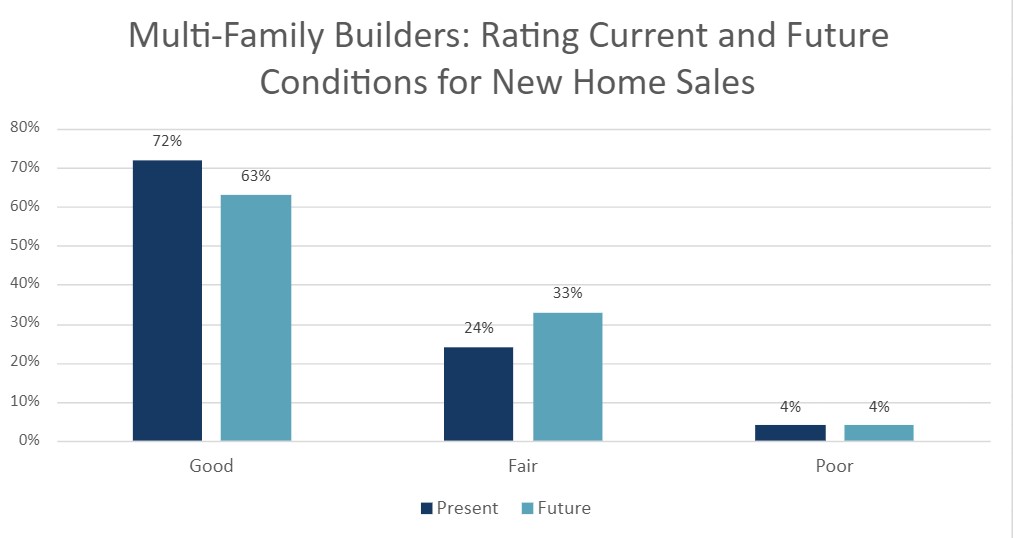
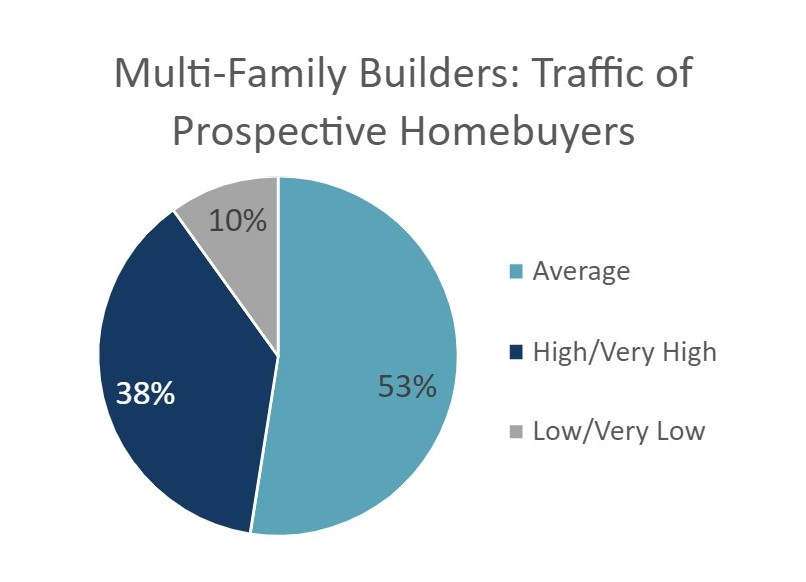
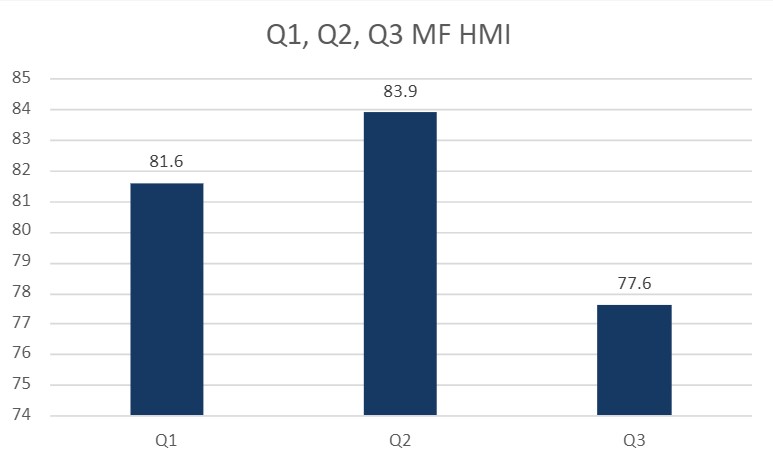
In addition to the survey questions that help develop the HMI, CHBA included a few additional “special questions” to ask the expert panel. These special questions allow us to better understand the results of the HMI and other industry issues. CHBA has opted to address the following questions in the Q3 survey:
- Almost 68% of CHBA members said that their lumber costs went up by more than $20,000 and 25% of respondents indicated that their costs increased by more than $40,000 as a result of surging lumber prices. National average construction cost increases for a 2,374 sq ft home are $34,562. This is 1.8 times higher than when we conducted the survey in Q1 2021. The highest average cost increase was found to be in New Brunswick (a 116% jump from what was reported in the Q1 survey).
- Over one third of respondents said that their construction costs due to rising prices of other materials (outside of lumber) have gone up by more than $20,000, which is double what we saw in the Q1 survey. However, it is also 17% less than what was reported in the Q2 survey, indicating overall construction cost increases may be cooling. The national average construction cost increases (other than lumber) for a 2,374 sq ft home are $25,282. British Columbia’s average cost increase was highest, at $32,308.
- Combining the lumber cost increase with the other construction material cost increases on a 2,374 sq ft home, the total construction cost increase is almost $60,000. This is obviously a very high number.
- Lumber availability and pricing continue to be a significant issue for our members as almost 73% of panelists are having trouble accessing lumber products with the majority (58%) indicating that other structural wood products (e.g., I-joists) have been difficult to access. However, about 27% said that they are currently not having any issues accessing lumber products.
- On average, supply chain issues have resulted in almost 7 weeks in delays in home completions for builders across Canada. The average delay is up by one week since we asked this same question in the Q1 survey. The highest average delay was reported by CHBA members in Newfoundland and Labrador, at 10 weeks. Twenty-four percent of respondents indicated that supply chain issues have resulted in over 9 weeks in delays.
- Overall, the panelists outlined several key challenges due to supply chain issues. Appliances were by far the most mentioned product that has been impacted, followed by plumbing materials and plumbing fixtures and windows. Compared to the Q1 survey, these responses were unchanged, and these three products continue to be the most affected by supply chain issues. The only difference between the two surveys is that in Q1 doors were in fourth place, while in Q3, we can see that bathtubs, showers and sinks are now in fourth place.
- Fifty-five percent of respondents indicated that price volatility has resulted in their company delaying some pre-sales and/or development. Compared to the Q1 survey, this number is up 12%.
- Over 82% of CHBA members explained that with respect to trades, prices are up.
- Sixty-one percent of builders stated that access to trades is difficult, and 60% noted this is causing construction delays. On average, the cost of labour/trades has gone up 19%, compared to prior to the pandemic. The highest average cost of labour/trades increase was found to be in Nova Scotia, where the cost of labour/trades increased by 26%, on average.
- Twenty-six percent of CHBA's panel said that the recently introduced increase to the stress test has impacted home sales for their company.
- Federal government support programs like the Canada Recovery Benefit are currently impacting the ability for CHBA members to find workers on their job sites, according to 64% of CHBA’s panel of builders.
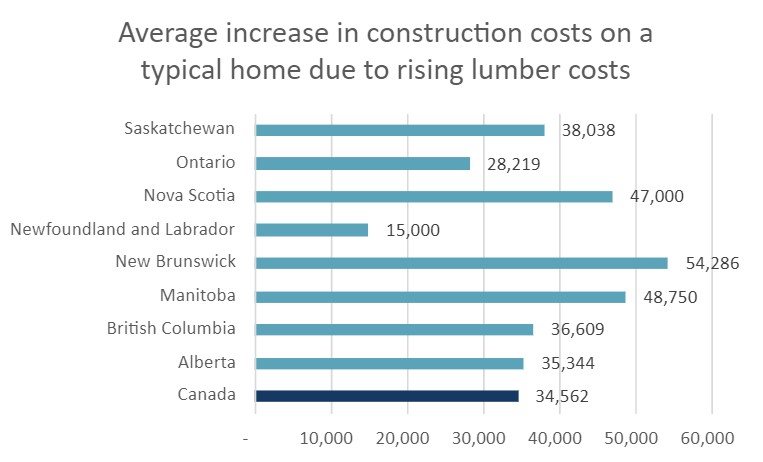
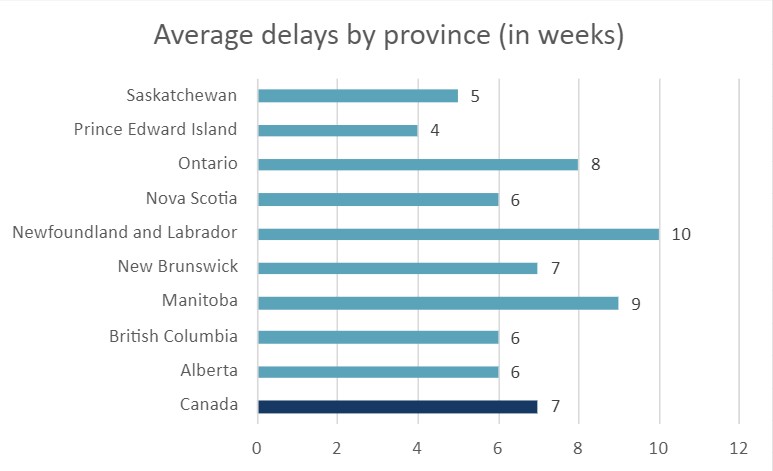
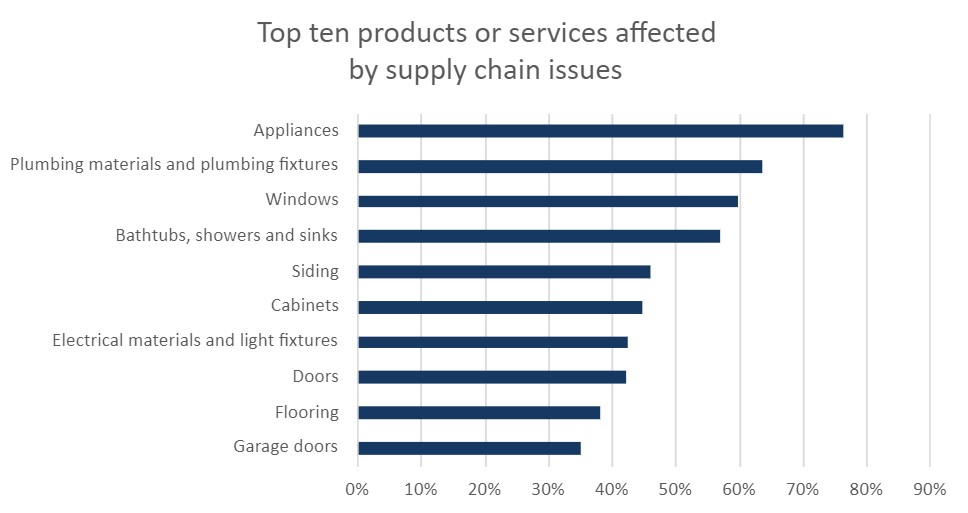
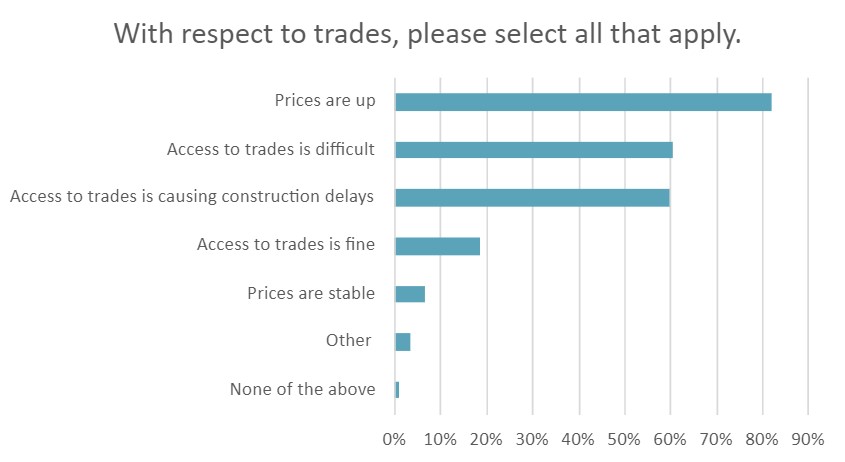
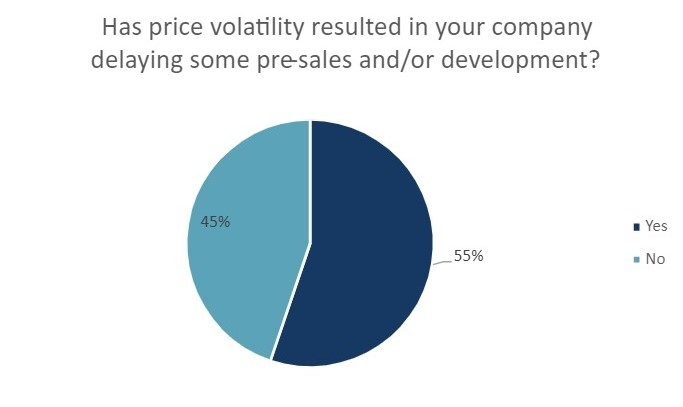
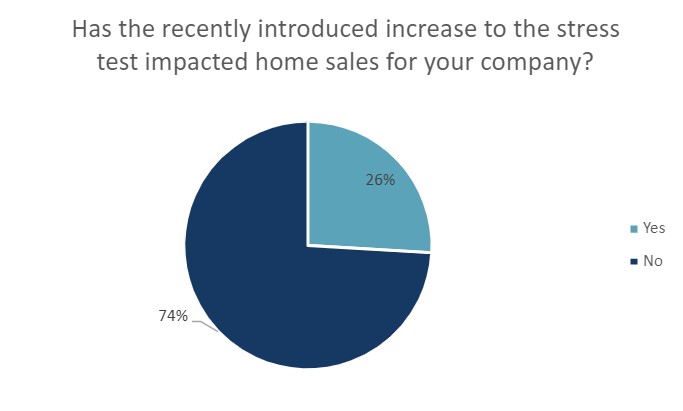
- The CHBA HMI shows that builder confidence in the single-family market was high in Q2 2021, at 82.9.
- Given the HMI uses a 100-point scale, this is a high sentiment number, reflecting strong builder confidence. As a comparator, NAHB’s single-family HMI (which is similar to CHBA’s) hit 90, a record high, in November 2020. It came down to 82 on average in Q2 as a result of increasing lumber prices and other supply chain issues. Ninety is the highest NAHB HMI score since NAHB started collecting this data in 1985.
- In Q1 2021, the single-family HMI was 83.2, hence the 82.9 Q2 rating is a slight decline between the two quarters. Despite the slight decline, the reading above 80 indicates a signal of strong demand in the housing market. The COVID-19 pandemic has accelerated homeownership aspirations for many and the demand for more space and living outside of the urban core continues to fuel the growth of the single-family market. Note that HMI numbers are not seasonally adjusted.
- The majority of single-family builders rated current and future conditions as Good (80% and 70%, respectively). Comparing Q1 and Q2 data, in Q2 about 3% more builders rated current conditions as Good, indicating strong current sales as predicted for future sales in Q1; also in Q2, about 3% fewer builders rated future conditions as Good, reflecting the uncertainty around potential interest rate changes and the impact of the stress test on the market.
- 56% of single-family builders rated the traffic of prospective homebuyers to be High to Very High, down 7% since we conducted the Q1 survey. This is also visible in the housing starts and building permits data that have started slowing from their historical highs. While this indicates a gradual softening in the market quarter-to-quarter and month-over-month, the year-over-year data still shows extreme strength and growth in the housing market.
- We asked the respondents who selected a High to Very High or Average rating to provide more insights and we found that 68% of builders attribute the traffic of prospective homebuyers to high demand for new home construction, reflecting the market that has evolved through the pandemic.
- Meanwhile, the respondents who found prospective buyer traffic to be low attribute it to rising lumber and other materials' prices driving up construction costs and sales prices.
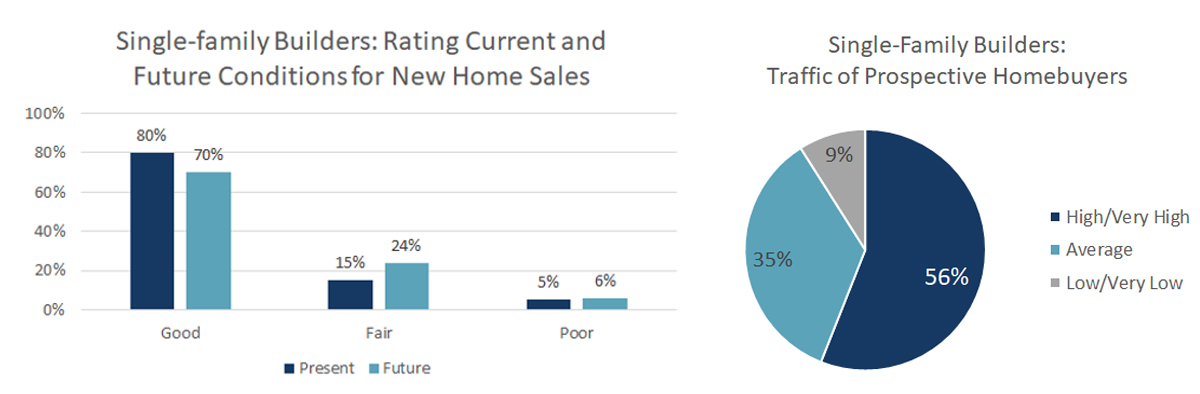
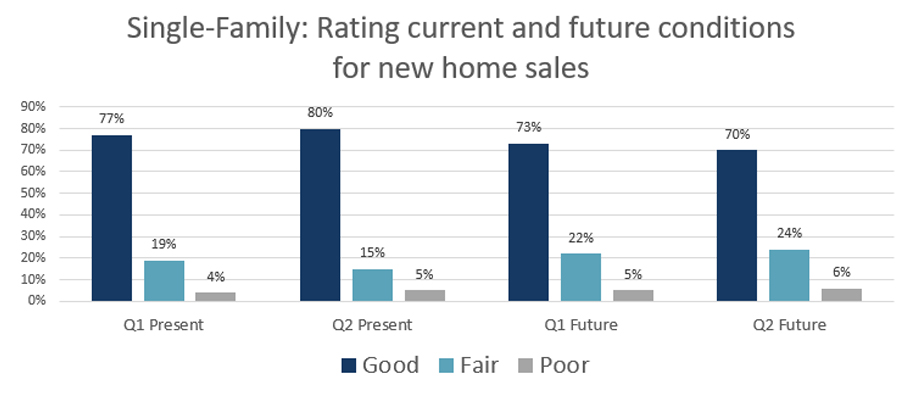
- The CHBA HMI for multi-family builders was 83.9 in Q2 2021, increasing by 2.3 points since Q1 2021. This is reflective of increasing condo demand in the past few months. At the onset of the pandemic, condo demand declined slightly as more people were interested in having a larger space and living outside of the urban core. With a rebounding economy and accelerated vaccine administrations across the country, we are seeing condo demand tick back up again.
- The majority of multi-family builders rated both current and future conditions as Good (79% and 70%, respectively). As with the single-family builders, about 3% fewer multi-family builders rated future conditions as Good in Q2 2021, which reflects the uncertainty around certain aspects of the housing market including impacts of the stress test changes.
- That said, 54% of multi-family builders indicated that traffic of prospective homebuyers was High to Very High.
- We asked the respondents who selected a High to Very High or Average rating to explain why they selected this rating and we found that 68% of builders attribute the traffic of prospective homebuyers to high demand for new condo construction, which was originally slow during COVID but has accelerated in recent times.
- 45% of builders noted that the traffic of prospective homebuyers is currently low and is indicative of home sales slowing.
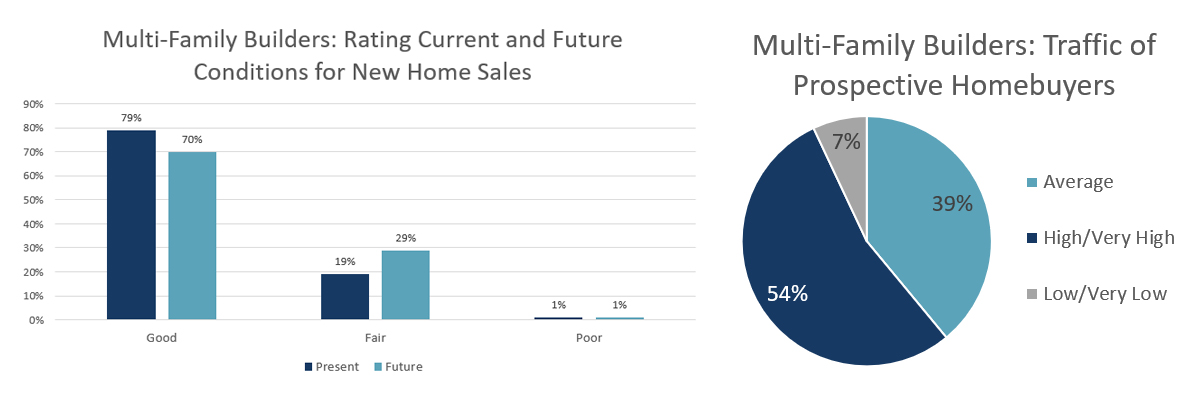
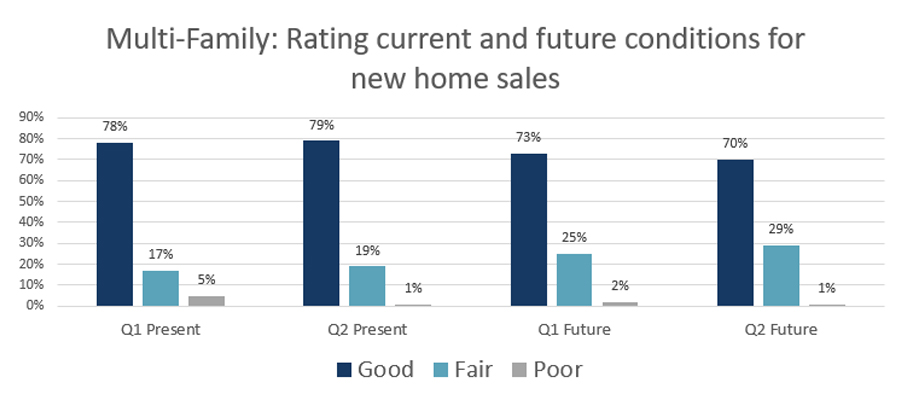
In addition to the survey questions that help develop the HMI, CHBA included a few additional “special questions” to ask the expert panel. These special questions allow us to better understand the results of the HMI and other industry issues. Given the volatility of supply chains, CHBA has opted to address the following questions in the Q2 survey:
- Overall, 84% of builders have increased the price of homes as a result of increasing lumber prices and 72% of respondents have started ordering/securing prices as far in advance as possible.
- Out of the builders who increased the price of homes, 35% were located in British Columbia, followed by Ontario (31%) and the Prairie Provinces (31%).
- Over half (52%) of CHBA members said that their construction costs went up by more than $30,000 and an overwhelming 30% of respondents indicated that their costs increased by more than $40,000 as a result of surging lumber prices.
- About 42% of respondents said that their construction costs due to rising prices of other materials (outside of lumber) have gone up by between by over $20,000.
- Many builders have started substituting certain materials due to the continuously rising prices. Out of the respondents who have started substituting materials, 50% have started substituting insulated concrete forms and foam sheathing.
- In Q1, the average overall construction delay nationally was 6 weeks due to material shortages. This question was not repeated in Q2, but all indications are that these delays have increased.
- Skilled trades shortages in terms of access to trades were also identified by over 40% of respondents, with 79% indicating prices with respect to trades have increased.
- Almost half (46%) of the builders are experiencing roadblocks between the time a sales contract is signed and a building permit is issued.
- The lengthy timelines were especially prominent in British Columbia and Ontario.
- Once a permit is issued, home construction for most (43%) tends to begin in less than two weeks, reflecting builders’ ability to get moving quickly once the municipality has given necessary approval.

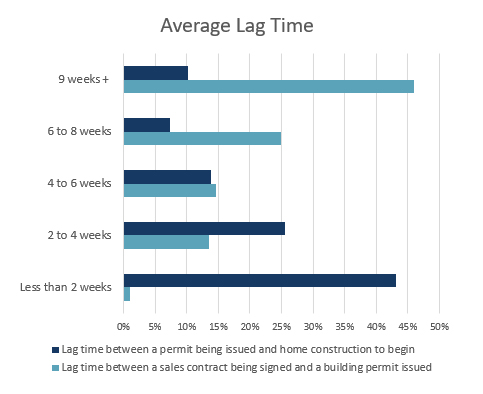

- The CHBA HMI for single-family builders is 83.2 in Q1 2021.
- Given the HMI uses a 100-point scale, this is a high sentiment number, reflecting strong builder confidence. As a comparator, NAHB’s single-family HMI (which is similar to CHBA’s) hit 90, a record high, in November 2020. It came down to 83 on average in Q1 as lumber and other supply issues. 90 is the highest NAHB HMI score since NAHB started collecting this data in 1985.
- The majority of single-family builders rated current and future conditions as Good (77% and 73%, respectively).
- 63% of single-family builders rated the traffic of prospective homebuyers to be High/Very High.
- Across the three HMI questions, sentiment declines as the average increase in construction costs due to increasing lumber prices rises. Respondents who indicated that conditions are Poor had an average increase of costs of 13% higher (for both current and future conditions) than those who indicated that conditions are Good.
- In terms of traffic of prospective homebuyers, the difference between the averages of the respondents who rated conditions as Good was 12% higher than the respondents who rated conditions as Poor.
- The traffic of prospective homebuyers question shows a direct relationship between sentiment and delay, with sentiment declining as delay rises. Overall, the average delay for the respondents who indicated traffic is Low to Very Low was over 11 weeks while those who rated the traffic to be High/Very High had an average delay of 5.45 weeks.
- Single-family builders who rated current conditions as Good were more likely to say that their workforce has fully rebounded.
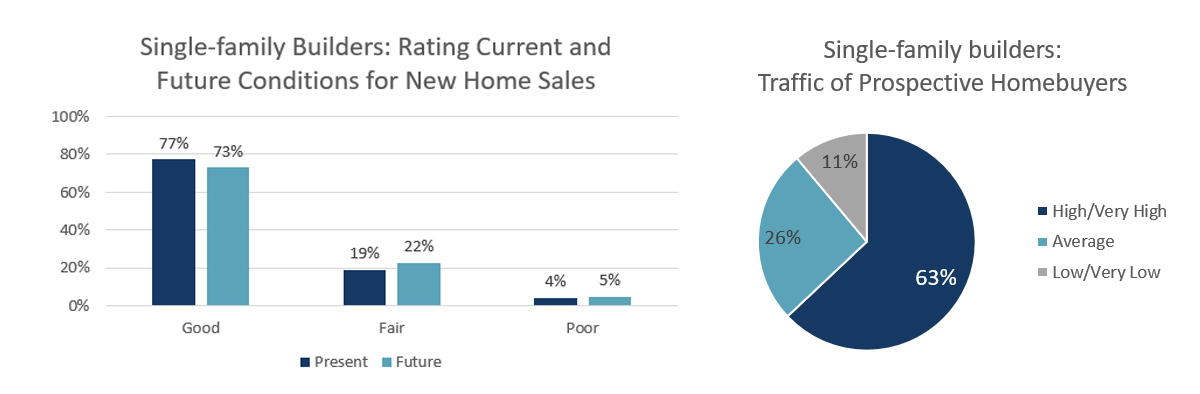
- The CHBA HMI for multi-family builders is 81.6 in Q1 2021.
- The majority of multi-family builders rated both current and future conditions as Good (78% and 73%, respectively).
- 56% of multi-family builders indicated that they expect the traffic of prospective homebuyers to be High to Very High.
- When asking builders about current conditions and the traffic of prospective homebuyers, we can see that the average increase in construction costs due to increasing lumber prices rises as sentiment declines. Respondents who indicated that conditions are Poor had an average increase of costs of 11% higher (for current conditions) than those who selected Good.
- The traffic of prospective homebuyers question shows a direct relationship between sentiment and delay, as sentiment declines as delay rises. Overall, the average delay for the respondents who indicated conditions are Low to Very Low is 57% higher.
- For the costs associated with other supply chain issues, the average increased construction costs rise consistently across the three HMI questions as sentiment declines.
- Multi-family builders who rated current conditions as Good and Fair were more likely to say that their workforce has fully rebounded.
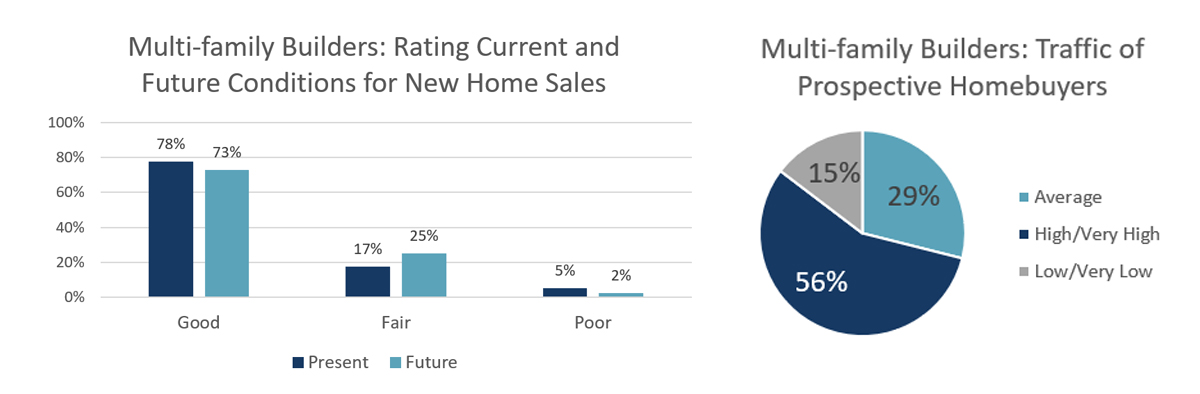
In addition to the survey questions that help develop the HMI, CHBA included a few additional “special questions” to ask the expert panel. These special questions allow us to better understand the results of the HMI and other industry issues. The special questions are optional and may not be asked for every round of the survey. Given the volatility of supply chains, CHBA has opted to address the following questions in the Q1 survey:
- Most builders (34%) indicated that the higher cost of lumber increased their construction costs by between $10,001 to $20,000.
- All increased construction costs are significantly higher for single-family homes; however, the average delay is shorter for single-family homes than townhomes (5.48 weeks in delays versus 7.8 weeks in delays).
- About 60% of builders indicated that supply chain issues resulted in significant cost increases and delays in home completions.
- National average construction cost increases for a 2,232 sq ft home are $19,447.
- On average, supply chain issues have resulted in almost 6 weeks of delays in home completions for builders in Canada.
- Overall, the panelists outlined several key challenges due to supply chain issues. Appliances were by far the most mentioned product that has been impacted.
- 43% of panelists indicated that price volatility has resulted in their company delaying some pre-sales and/or development.
- 68% of respondents indicated that their workforce has fully rebounded.
- 21% are having trouble hiring staff.
- Only 3% of survey respondents said that they have not rebounded.
- Almost 60% of respondents indicated that hiring will increase over the next six months.
- Most respondents (37%) indicated that with respect to trades, costs are up.
Single-family respondents and the HMI:
- Across all three HMI questions, the average increase in construction costs due to increasing lumber costs rises as sentiment declines.
- Respondents who rated conditions as Poor had a higher average increase in costs (13%) than those who rated conditions as Good.
- This was also the case in terms of the traffic of prospective homebuyers question, where the difference between those who rated conditions highly and those who rated conditions poorly was 12%.
- Average delay goes up as sentiment goes down for the traffic of prospective homebuyers.
Multi-family respondents and the HMI:
- When asking builders about current conditions and the traffic of prospective homebuyers, one can see that the average increase in construction costs due to increasing lumber prices rises as sentiment declines.
- Respondents who indicated that conditions are Poor had an average increase of costs of 11% higher than those who indicated that conditions are Good.
- The traffic of prospective homebuyers question shows a direct relationship between sentiment and delay, as sentiment declines as delay rises. Overall, the average delay for the respondents who indicated conditions are Low to Very Low is 57% higher.