Renovation Market Index

Are you a Renovator interested in being part of the RMI panel of respondents?

Spring 2026 RMI

Properties of the RMI
(i.e. how to read the number)
- The RMI is on a scale of 0 to 100
- It's 0 only when everyone says conditions are "poor"
- It's 100 only when everyone says conditions are "good"
- It's 50 when the % saying "good" = the % saying "poor"
- 50 is therefore a neutral score; the higher above 50 the RMI, the more positive the outlook is from renovators; the further below 50, the worse the outlook
Spring 2026 Renovation Market Index (RMI)
This page outlines the Spring 2026 results of CHBA’s Renovation Market Index (RMI). This research and economics product provides an indicator of the current and future health of Canada’s residential renovation industry. The RMI is a sentiment indicator, assessing current renovation activity, expectations for renovation activity over the next six months, and the level of client inquiries and project pipelines. It is designed to provide early insight into renovation spending trends and the outlook for the health of the home improvement sector in Canada.
The data for the CHBA RMI comes from a panel of CHBA renovation-focused member businesses, who are surveyed about current business conditions and future expectations. In addition to the standard RMI questions, each quarter CHBA asks “special questions” to gather data and insights into current issues affecting renovators and the broader home improvement industry across the country.
The RMI builds on the success and credibility of CHBA’s Housing Market Index (HMI), expanding CHBA’s ability to capture renovation-specific trends. Inspired by the NAHB/Westlake Royal Remodeling Market Index (NAHB RMI), the CHBA survey about renovation conditions does differ in that it is based on project types rather than project costs to better allow comparisons of activity across regions. Given the importance of residential renovation activity to housing quality, housing supply, employment, and overall economic performance, the RMI is designed to inform policymakers, economists, financial analysts, industry stakeholders, and the media about evolving conditions in Canada’s renovation market.
If you have any questions or feedback about the CHBA Residential Renovation Market Index, please contact rmi@chba.ca
Summary for Spring 2026 Renovation Market Index (RMI)
Renovator sentiment still in neutral territory, and modest strength being seen in interior renovations
The second edition of the Renovation Market Index (RMI) reflects the business confidence of residential renovation and repair contractors during the spring of 2026. The RMI was 50.3, a perfectly neutral score and up mildly from 48.3 in late 2025. Neutral sentiment was exhibited by both the current conditions subindex at 52 and future conditions subindex at 45.2. As a comparison, the NAHB Remodelling Market Index averaged 62 throughout 2025 and registered 62 in the first quarter of 2026 as well.
Regional RMI results continued to track similarly to what renovators expressed in the Fall 2025 edition and how new home builders are reporting sales conditions via CHBA’s Housing Market Index. The strongest result was in Atlantic Canada, which held a mildly optimistic score of 62.6. The prairie provinces were just inside neutral territory at 59.2. Meanwhile, in danger of moving into pessimistic territory having fallen 6 points since the previous RMI, Ontario’s score of 40.1 was the lowest of all regions. British Columbia did not fare much better, with a score of 43.1.
Within the current conditions subindex, renovators report a substantial variation in the differences between various project types. Three or more interior room renovation conditions were neutral at 54. Meanwhile, one or two interior rooms renovations were quite optimistic at 65. In terms of exterior renovations, new additions were 39 and exterior envelope and landscaping conditions were 42. Accessory suites (both attached and detached) were the most pessimistic renovation category at 29. This is likely due to the state of new home construction and the size of this market relative to all other renovation types. Finally, conditions for retrofits and repairs work held a neutral score of 59.
Like the inaugural autumn survey, the length of backlog remained a concerning topic for renovators. Only 13% of renovators said their backlog was longer than average, while 41% said it was shorter. The respondents that said their backlog was shorter were asked why they think this is the case. Overwhelmingly, renovators stated that consumer uncertainty meant they are more reluctant to move ahead with a project or more likely to reduce the original scope of the renovation. There was no mention from renovators that current projects were being completed faster.
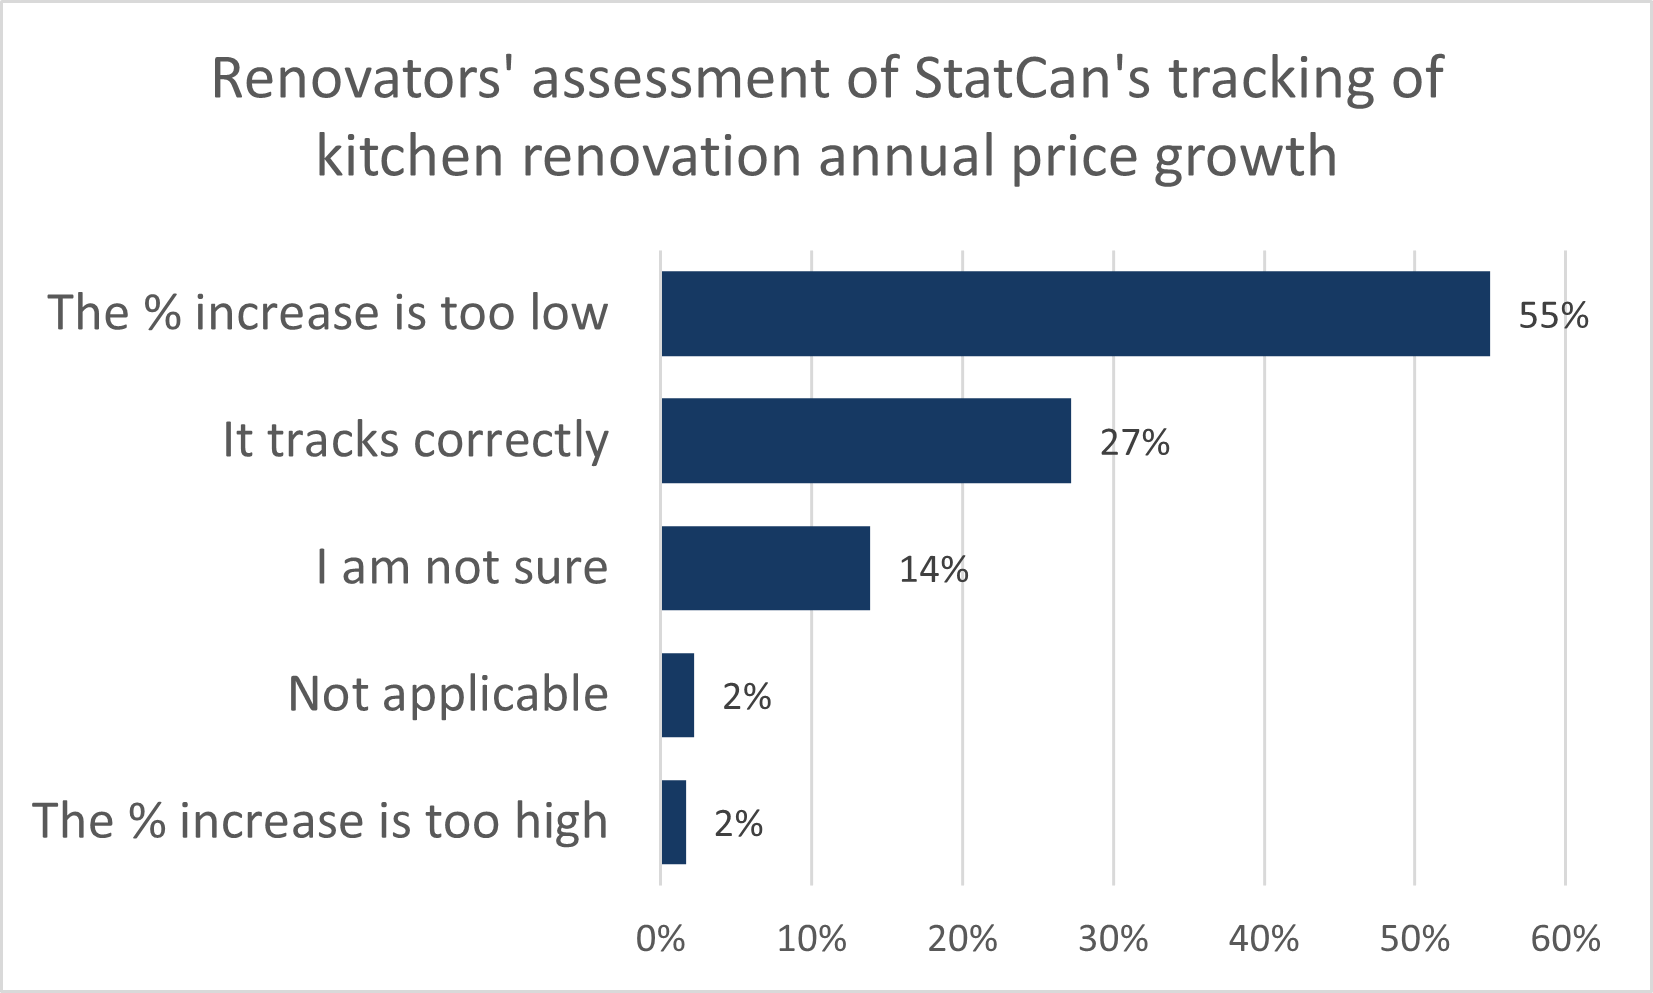
As a slow growth industry, moving in line with Canada’s expanding and aging housing stock, nominal output of residential renovations has stagnated at roughly $80 billion a year since 2023. At the same time, labour, materials, and regulatory processes continue to meaningfully raise the costs that renovators face. Feedback from renovators suggests that the 3% year-over-year increase reported by Statistics Canada’s Residential Renovation Price Index understates the true cost increases. When accounting for inflation, real GDP for residential construction fell 1.6% quarter over quarter to $51.3 billion in Q1 2026—roughly the same output that was last seen in 2013. The results of the Spring RMI suggest that renovation investment will grow in 2026 at a pace below that of the broader economy, likely below 1%.